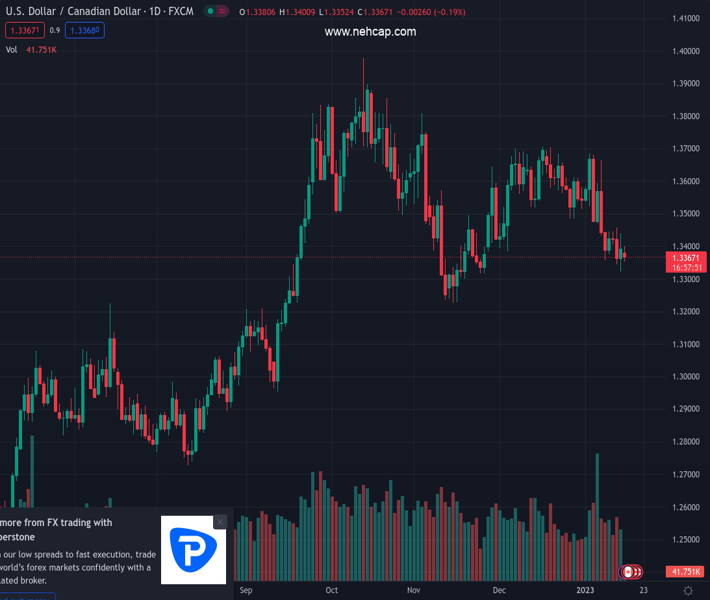
#USDCAD @ 1.33673 comes under renewed selling pressure on Monday amid sustained USD weakness. (Pivot Orderbook analysis)
…
This is a premium post.
[s2If !current_user_can(access_s2member_level4)]Please register for PREMIUM VERSION HERE to read full post below containing analysis. In case of any error or you think you are not able to read the full post below, please email us at support#nehcap.com [lwa][/s2If] [s2If current_user_can(access_s2member_level4)]
- USD/CAD comes under renewed selling pressure on Monday amid sustained USD weakness.
- Rising bets for smaller Fed rate hikes and a positive risk tone continue to weigh on the buck.
- A modest pullback in oil prices could undermine the Loonie and help limit any further losses.
The pair currently trades last at 1.33673.
The previous day high was 1.344 while the previous day low was 1.3322. The daily 38.2% Fib levels comes at 1.3395, expected to provide resistance. Similarly, the daily 61.8% fib level is at 1.3367, expected to provide support.
The USD/CAD pair struggles to capitalize on Friday’s bounce from the 1.3320 area, or its lowest level since November 25 and meets with a fresh supply on the first day of a new week. The pair remains on the defensive through the Asian session and is currently placed near the daily low, around mid-1.3300s.
The US Dollar extends its recent sell-off and drops to a fresh seven-month low amid speculations that the Fed may be nearing the end of its rate-hike cycle. This, in turn, is seen as a key factor exerting downward pressure on the USD/CAD pair. Investors now seem convinced that the US central bank will soften its hawkish stance and have started pricing in a smaller rate hike going forward. The bets were lifted by last week’s US consumer inflation figures, which showed that the headline CPI fell for the first time in more than 2-1/2 years in December.
Adding to this, several Fed officials backed the case for a 25 bps lift-off in February. This, along with a generally positive tone around the equity markets, continues to weigh on the safe-haven buck. That said, growing worries about a deeper global economic downturn should keep a lid on the optimism and lend some support to the greenback. Apart from this, a modest pullback in crude oil prices could undermine the commodity-linked Loonie and further contribute to limiting the downside for the USD/CAD pair, at least for the time being. The mixed fundamental backdrop warrants caution for aggressive bearish traders and positioning for any further losses.
The US markets will remain closed on Monday in observance of Martin Luther King Jr. Day. Moreover, there isn’t any major market-moving economic data due for release from Canada. Hence, traders will look to the Bank of Canada’s Business Outlook Survey report for some impetus around the USD/CAD pair. Apart from this, oil price dynamics should influence the Canadian Dollar and allow traders to grab short-term opportunities around the major.
Technical Levels: Supports and Resistances
USDCAD currently trading at 1.3358 at the time of writing. Pair opened at 1.3392 and is trading with a change of -0.25 % .
| Overview | Overview.1 | |
|---|---|---|
| 0 | Today last price | 1.3358 |
| 1 | Today Daily Change | -0.0034 |
| 2 | Today Daily Change % | -0.2500 |
| 3 | Today daily open | 1.3392 |
The pair is trading below its 20 Daily moving average @ 1.3533, below its 50 Daily moving average @ 1.3498 , below its 100 Daily moving average @ 1.3496 and above its 200 Daily moving average @ 1.3169
| Trends | Trends.1 | |
|---|---|---|
| 0 | Daily SMA20 | 1.3533 |
| 1 | Daily SMA50 | 1.3498 |
| 2 | Daily SMA100 | 1.3496 |
| 3 | Daily SMA200 | 1.3169 |
The previous day high was 1.344 while the previous day low was 1.3322. The daily 38.2% Fib levels comes at 1.3395, expected to provide resistance. Similarly, the daily 61.8% fib level is at 1.3367, expected to provide support.
Note the levels of interest below:
- Pivot support is noted at 1.3329, 1.3267, 1.3212
- Pivot resistance is noted at 1.3447, 1.3502, 1.3565
| Levels | Levels.1 |
|---|---|
| Previous Daily High | 1.3440 |
| Previous Daily Low | 1.3322 |
| Previous Weekly High | 1.3461 |
| Previous Weekly Low | 1.3322 |
| Previous Monthly High | 1.3705 |
| Previous Monthly Low | 1.3385 |
| Daily Fibonacci 38.2% | 1.3395 |
| Daily Fibonacci 61.8% | 1.3367 |
| Daily Pivot Point S1 | 1.3329 |
| Daily Pivot Point S2 | 1.3267 |
| Daily Pivot Point S3 | 1.3212 |
| Daily Pivot Point R1 | 1.3447 |
| Daily Pivot Point R2 | 1.3502 |
| Daily Pivot Point R3 | 1.3565 |
[/s2If]
Join Our Telegram Group
")


