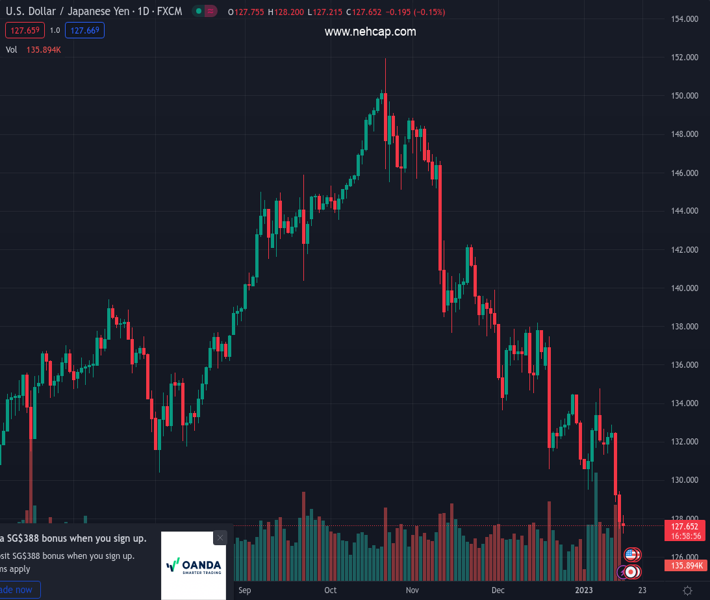
Japanese stocks have witnessed an intense sell-off as investors have turned anxious ahead of BOJ policy. (Pivot Orderbook analysis)
…
This is a premium post.
[s2If !current_user_can(access_s2member_level4)]Please register for PREMIUM VERSION HERE to read full post below containing analysis. In case of any error or you think you are not able to read the full post below, please email us at support#nehcap.com [lwa][/s2If] [s2If current_user_can(access_s2member_level4)]
- Japanese stocks have witnessed an intense sell-off as investors have turned anxious ahead of BOJ policy.
- Chinese equities are riding a bull run on expectations of easing policy to support reopening reforms.
- The USD Index has refreshed its seven-month low amid a significant improvement in investors’ risk appetite.
The pair currently trades last at 25839.9.
The previous day high was 26130.55 while the previous day low was 25721.43. The daily 38.2% Fib levels comes at 25877.71, expected to provide resistance. Similarly, the daily 61.8% fib level is at 25974.27, expected to provide resistance.
Markets in the Asian domain are delivering mixed signals on Monday. Japanese markets have witnessed a massive sell-off as investors are awaiting the announcement of the Bank of Japan (BOJ) monetary policy on Wednesday. Meanwhile, Chinese markets have picked up sheer strength.
At the press time, Japan’s Nikkei225 plunged 1.32%, SZSE Component soared 2.11%, Hang Seng jumped 0.74%, and Nifty50 added 0.12%.
The US Dollar Index (DXY) has refreshed its seven-month low at 101.45 amid the soaring risk appetite of the market participants. Escalating odds of further policy easing by the Federal Reserve (Fed) have resulted in sheer strength in the S&P500 futures. The 500-stock basket futures of the United States have continued their upside momentum after a super-bullish week. Investors should note that US markets are closed on account of Martin Luther King Jr. Day.
Japanese equities have been dumped by the market participants as investors are getting nervous ahead of the BOJ’s monetary policy announcement. BOJ officials are continuously buying bonds vigorously but simultaneously considering an exit from a decade-long ultra-loose policy. Ambiguity among actions of the BOJ has resulted in anxiety among investors.
Hiroshige Seko, Japan’s Liberal Democratic Party’s Upper House Secretary General, said in a Bloomberg interview on Friday that “it would be premature to start exiting stimulus when demand continues to lag behind supply in Japan’s economy.”
Meanwhile, Chinese stocks are rallying as optimism soars for policy easing by the People’s Bank of China (PBoC) to support bold steps of reopening and supporting weak housing demand. A sense of deflation in the Producer Price index (PPI) is likely to continue through the first half of CY2023 as expected by Ho Woei Chen, Economist at UOB Group.
He further added that “We see prospects for the 1Y LPR to fall to 3.55% and 5Y LPR to 4.20% by end1Q23. The consensus forecast is factoring in the possibility of a 5-15 bps decline in the 5Y LPR at the upcoming fixing on 20 Jan, which will reduce mortgage costs for homebuyers. Meanwhile, the 1Y LPR may stay unchanged this month given flushed domestic liquidity.”
On the oil front, the oil price has failed to sustain above the crucial resistance of $80.00 despite optimism for China’s reopening. On the sidelines of Atlantic Council’s Global Energy Forum in Abu Dhabi over the weekend, UAE Energy Minister Suhail al-Mazrouei said that the oil market is ‘stable’ at the moment, unperturbed by the price caps on Russian crude oil. This might result in a resumption of the upside move in oil price ahead.
Technical Levels: Supports and Resistances
USDJPY currently trading at 25839.9 at the time of writing. Pair opened at 25839.9 and is trading with a change of 0.0 % .
| Overview | Overview.1 | |
|---|---|---|
| 0 | Today last price | 25839.9 |
| 1 | Today Daily Change | 0.0 |
| 2 | Today Daily Change % | 0.0 |
| 3 | Today daily open | 25839.9 |
The pair remains strongly bearish on the daily time frame. It trades below the 20 SMA @ 26210.02, 50 SMA 27252.67, 100 SMA @ 27276.3 and 200 SMA @ 27217.0.
| Trends | Trends.1 | |
|---|---|---|
| 0 | Daily SMA20 | 26210.02 |
| 1 | Daily SMA50 | 27252.67 |
| 2 | Daily SMA100 | 27276.30 |
| 3 | Daily SMA200 | 27217.00 |
The previous day high was 26130.55 while the previous day low was 25721.43. The daily 38.2% Fib levels comes at 25877.71, expected to provide resistance. Similarly, the daily 61.8% fib level is at 25974.27, expected to provide resistance.
Note the levels of interest below:
- Pivot support is noted at 25664.04, 25488.17, 25254.92
- Pivot resistance is noted at 26073.16, 26306.41, 26482.28
| Levels | Levels.1 |
|---|---|
| Previous Daily High | 26130.55 |
| Previous Daily Low | 25721.43 |
| Previous Weekly High | 26578.67 |
| Previous Weekly Low | 25721.43 |
| Previous Monthly High | 28325.89 |
| Previous Monthly Low | 25793.22 |
| Daily Fibonacci 38.2% | 25877.71 |
| Daily Fibonacci 61.8% | 25974.27 |
| Daily Pivot Point S1 | 25664.04 |
| Daily Pivot Point S2 | 25488.17 |
| Daily Pivot Point S3 | 25254.92 |
| Daily Pivot Point R1 | 26073.16 |
| Daily Pivot Point R2 | 26306.41 |
| Daily Pivot Point R3 | 26482.28 |
[/s2If]
Join Our Telegram Group
")


