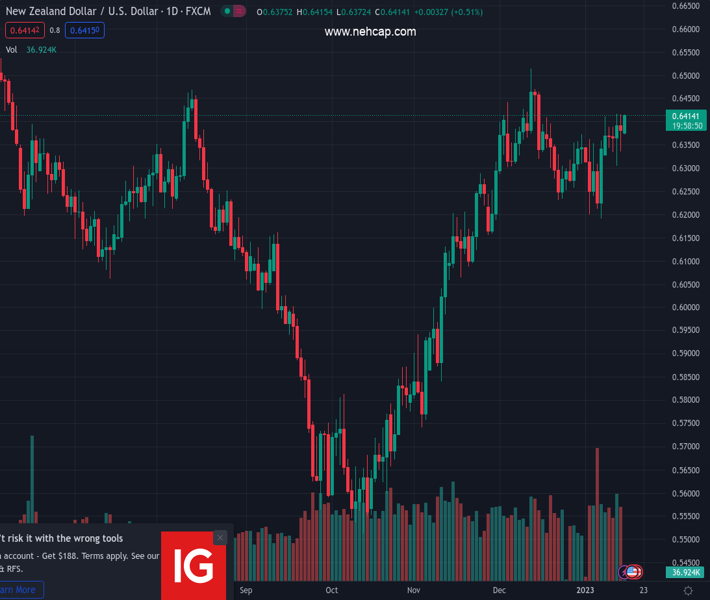
#NZDUSD @ 0.64129 A bullish reversal seems likely on an Inverted H&S formation on the daily chart. (Pivot Orderbook analysis)
…
This is a premium post.
[s2If !current_user_can(access_s2member_level4)]Please register for PREMIUM VERSION HERE to read full post below containing analysis. In case of any error or you think you are not able to read the full post below, please email us at support#nehcap.com [lwa][/s2If] [s2If current_user_can(access_s2member_level4)]
- A bullish reversal seems likely on an Inverted H&S formation on the daily chart.
- The 20-and 50-EMAs have resumed their upside journey which adds to the upside filters.
- A shift into the bullish range of 60.00-80.00 by the RSI (14) will strengthen the New Zealand Dollar.
The pair currently trades last at 0.64129.
The previous day high was 0.6417 while the previous day low was 0.6335. The daily 38.2% Fib levels comes at 0.6366, expected to provide support. Similarly, the daily 61.8% fib level is at 0.6385, expected to provide support.
The NZD/USD pair is facing hurdles in surpassing the immediate resistance of 0.6400 in the Tokyo session. The Kiwi asset is expected to extend its rally to near the critical resistance of 0.615 amid optimism in market sentiment.
An improvement in the risk appetite of the market participants is further strengthening the S&P500 futures despite a four-day winning streak. Meanwhile, the US Dollar Index (DXY) is on the verge of testing a seven-month low around 101.60.
On a daily scale, NZD/USD has formed an Inverted Head and Shoulder chart pattern that indicates a bullish reversal, which is expected to strengthen the New Zealand Dollar ahead. The 20-and 50-period Exponential Moving Averages (EMAs) at 0.6352 and 0.6342 respectively have resumed their upside journey, which adds to the upside filters.
The Relative Strength Index (RSI) (14) is aiming to shift into the bullish range of 60.00-80.00, which indicates that the upside momentum is active.
For an upside move, the kiwi asset needs to surpass the previous week’s high at 0.6418, which will drive the major towards the psychological resistance at 0.6500 followed by June 6 high at 0.6538.
On the contrary, a slippage below January 12 low at 0.6314 will provide strength to the US Dollar, which will drag the asst toward December 22 low at 0.630. A slippage below the latter will expose the asst for more downside towards January 6 low at 0.6190.
Technical Levels: Supports and Resistances
NZDUSD currently trading at 0.6403 at the time of writing. Pair opened at 0.6387 and is trading with a change of 0.25 % .
| Overview | Overview.1 | |
|---|---|---|
| 0 | Today last price | 0.6403 |
| 1 | Today Daily Change | 0.0016 |
| 2 | Today Daily Change % | 0.2500 |
| 3 | Today daily open | 0.6387 |
The pair remains strongly bullish on the daily timeframe. It trades above its 20 SMA @ 0.6323, 50 SMA 0.6267, 100 SMA @ 0.6049 and 200 SMA @ 0.6211.
| Trends | Trends.1 | |
|---|---|---|
| 0 | Daily SMA20 | 0.6323 |
| 1 | Daily SMA50 | 0.6267 |
| 2 | Daily SMA100 | 0.6049 |
| 3 | Daily SMA200 | 0.6211 |
The previous day high was 0.6417 while the previous day low was 0.6335. The daily 38.2% Fib levels comes at 0.6366, expected to provide support. Similarly, the daily 61.8% fib level is at 0.6385, expected to provide support.
Note the levels of interest below:
- Pivot support is noted at 0.6342, 0.6298, 0.6261
- Pivot resistance is noted at 0.6424, 0.6461, 0.6505
| Levels | Levels.1 |
|---|---|
| Previous Daily High | 0.6417 |
| Previous Daily Low | 0.6335 |
| Previous Weekly High | 0.6418 |
| Previous Weekly Low | 0.6314 |
| Previous Monthly High | 0.6514 |
| Previous Monthly Low | 0.6230 |
| Daily Fibonacci 38.2% | 0.6366 |
| Daily Fibonacci 61.8% | 0.6385 |
| Daily Pivot Point S1 | 0.6342 |
| Daily Pivot Point S2 | 0.6298 |
| Daily Pivot Point S3 | 0.6261 |
| Daily Pivot Point R1 | 0.6424 |
| Daily Pivot Point R2 | 0.6461 |
| Daily Pivot Point R3 | 0.6505 |
[/s2If]
Join Our Telegram Group
")


