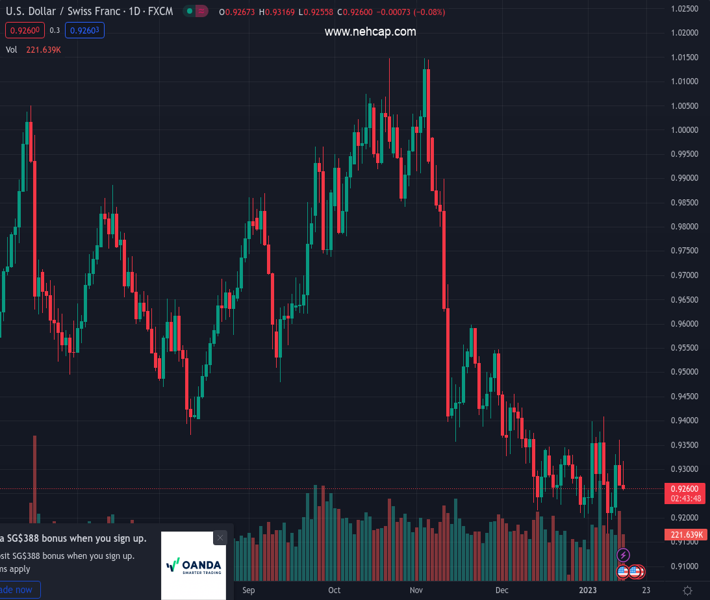
#USDCHF @ 0.92603 retraced earlier gains after printing a daily high of 0.9316. (Pivot Orderbook analysis)
…
This is a premium post.
[s2If !current_user_can(access_s2member_level4)]Please register for PREMIUM VERSION HERE to read full post below containing analysis. In case of any error or you think you are not able to read the full post below, please email us at support#nehcap.com [lwa][/s2If] [s2If current_user_can(access_s2member_level4)]
- USD/CHF retraced earlier gains after printing a daily high of 0.9316.
- Upbeat US economic data is bad for the greenback as the US Dollar weakens.
- USD/CHF Price Analysis: A break / daily close below 0.9300 would expose the pair to further selling pressure.
The pair currently trades last at 0.92603.
The previous day high was 0.9363 while the previous day low was 0.9266. The daily 38.2% Fib levels comes at 0.9303, expected to provide resistance. Similarly, the daily 61.8% fib level is at 0.9326, expected to provide resistance.
The USD/CHF is trading below its opening price, though it failed to crack the 20-day Exponential Moving Average (EMA) and missed to hold to 0.9300, albeit upbeat US data crossed newswires. Therefore, the USD/CHF is exchanging hands at 0.9265 at the time of writing.
Wall Street has resumed its uptrend after a brief hiccup that witnessed the S&P 500 and the Nasdaq turning red. Thursday’s release of softer inflation in the United States (US) spurred hopes for a less aggressive US Federal Reserve (Fed); hence the US Dollar (USD) weakened. A University of Michigan (UoM) survey showed that consumer sentiment improved, as it exceeded estimates of 60.5, hitting 64.6. In the same poll, inflation expectations for one year were revised to 4% from 4.4% in December, while for a five-year horizon, inflation is foreseen to hit 3% from 2.9% in the previous month.
In the meantime, the US Dollar Index (DXY), which measures the buck’s performance against a basket of six rivals, erases its earlier gains, down 0.04%, at 102.201.
During the session, the USD/CHF cleared the 20-day EMA at 0.9293 and cleared the 0.9300 mark. Nevertheless, as the greenback weakened, the major retreated those gains and is tumbling to fresh two-day lows around 0.9255.
From a technical perspective, the USD/CHF would likely continue its downtrend, though it’s fair to say that if not for the US CPI report missing estimates, the USD/CHF had momentum, and it could have tested the 50-day EMA at 0.9405. Aside from this, oscillators like the Relative Strength Index (RSI) and the Rate of Change (RoC) suggest that sellers remain in charge. Therefore, the USD/CHF key support levels would be 0.9200, followed by the current week’s low of 0.9167, ahead of the 2022 low of 0.9091.
Technical Levels: Supports and Resistances
USDCHF currently trading at 0.9264 at the time of writing. Pair opened at 0.928 and is trading with a change of -0.17 % .
| Overview | Overview.1 | |
|---|---|---|
| 0 | Today last price | 0.9264 |
| 1 | Today Daily Change | -0.0016 |
| 2 | Today Daily Change % | -0.1700 |
| 3 | Today daily open | 0.9280 |
The pair remains strongly bearish on the daily time frame. It trades below the 20 SMA @ 0.929, 50 SMA 0.9411, 100 SMA @ 0.9628 and 200 SMA @ 0.9644.
| Trends | Trends.1 | |
|---|---|---|
| 0 | Daily SMA20 | 0.9290 |
| 1 | Daily SMA50 | 0.9411 |
| 2 | Daily SMA100 | 0.9628 |
| 3 | Daily SMA200 | 0.9644 |
The previous day high was 0.9363 while the previous day low was 0.9266. The daily 38.2% Fib levels comes at 0.9303, expected to provide resistance. Similarly, the daily 61.8% fib level is at 0.9326, expected to provide resistance.
Note the levels of interest below:
- Pivot support is noted at 0.9243, 0.9206, 0.9147
- Pivot resistance is noted at 0.934, 0.9399, 0.9436
| Levels | Levels.1 |
|---|---|
| Previous Daily High | 0.9363 |
| Previous Daily Low | 0.9266 |
| Previous Weekly High | 0.9410 |
| Previous Weekly Low | 0.9223 |
| Previous Monthly High | 0.9471 |
| Previous Monthly Low | 0.9201 |
| Daily Fibonacci 38.2% | 0.9303 |
| Daily Fibonacci 61.8% | 0.9326 |
| Daily Pivot Point S1 | 0.9243 |
| Daily Pivot Point S2 | 0.9206 |
| Daily Pivot Point S3 | 0.9147 |
| Daily Pivot Point R1 | 0.9340 |
| Daily Pivot Point R2 | 0.9399 |
| Daily Pivot Point R3 | 0.9436 |
[/s2If]
Join Our Telegram Group
")


