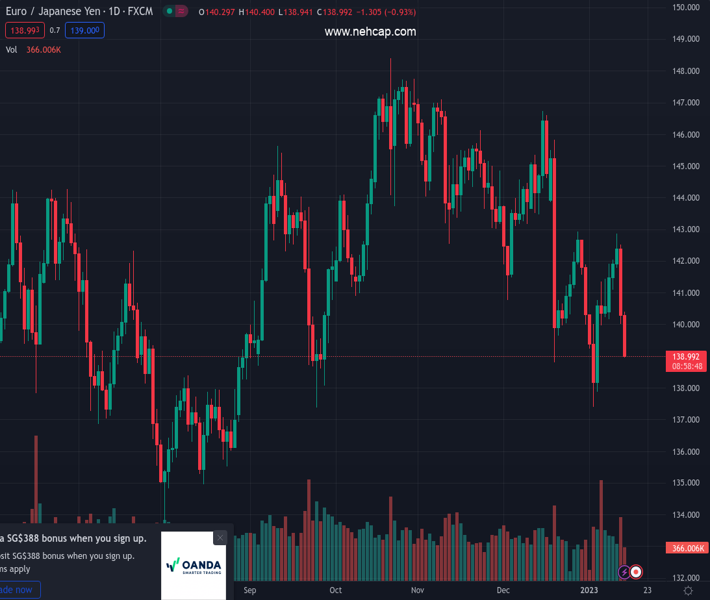
#EURJPY @ 138.968 adds to Thursday’s strong pullback and breaches 140.00. (Pivot Orderbook analysis)
…
This is a premium post.
[s2If !current_user_can(access_s2member_level4)]Please register for PREMIUM VERSION HERE to read full post below containing analysis. In case of any error or you think you are not able to read the full post below, please email us at support#nehcap.com [lwa][/s2If] [s2If current_user_can(access_s2member_level4)]
- EUR/JPY adds to Thursday’s strong pullback and breaches 140.00.
- The loss of the 200-day SMA opens the door to extra decline.
The pair currently trades last at 138.968.
The previous day high was 142.56 while the previous day low was 140.01. The daily 38.2% Fib levels comes at 140.99, expected to provide resistance. Similarly, the daily 61.8% fib level is at 141.59, expected to provide resistance.
EUR/JPY extends the weekly leg lower and drops to multi-session lows just below the 139.00 mark on Friday.
The acute correction forces the cross to break below the key 200-day SMA (140.67) and paves the way for a deeper retracement in the short term. Against that, EUR/JPY could revisit the so far YTD low at 137.38 (January 3), which also coincides with the September 2022 low.
The outlook for EUR/JPY should remain negative while below the 200-day SMA.
Technical Levels: Supports and Resistances
EURJPY currently trading at 139.07 at the time of writing. Pair opened at 140.21 and is trading with a change of -0.81 % .
| Overview | Overview.1 | |
|---|---|---|
| 0 | Today last price | 139.07 |
| 1 | Today Daily Change | 146.00 |
| 2 | Today Daily Change % | -0.81 |
| 3 | Today daily open | 140.21 |
The pair remains strongly bearish on the daily time frame. It trades below the 20 SMA @ 141.27, 50 SMA 143.22, 100 SMA @ 143.12 and 200 SMA @ 140.69.
| Trends | Trends.1 | |
|---|---|---|
| 0 | Daily SMA20 | 141.27 |
| 1 | Daily SMA50 | 143.22 |
| 2 | Daily SMA100 | 143.12 |
| 3 | Daily SMA200 | 140.69 |
The previous day high was 142.56 while the previous day low was 140.01. The daily 38.2% Fib levels comes at 140.99, expected to provide resistance. Similarly, the daily 61.8% fib level is at 141.59, expected to provide resistance.
Note the levels of interest below:
- Pivot support is noted at 139.29, 138.38, 136.74
- Pivot resistance is noted at 141.84, 143.48, 144.39
| Levels | Levels.1 |
|---|---|
| Previous Daily High | 142.56 |
| Previous Daily Low | 140.01 |
| Previous Weekly High | 141.45 |
| Previous Weekly Low | 137.39 |
| Previous Monthly High | 146.73 |
| Previous Monthly Low | 138.80 |
| Daily Fibonacci 38.2% | 140.99 |
| Daily Fibonacci 61.8% | 141.59 |
| Daily Pivot Point S1 | 139.29 |
| Daily Pivot Point S2 | 138.38 |
| Daily Pivot Point S3 | 136.74 |
| Daily Pivot Point R1 | 141.84 |
| Daily Pivot Point R2 | 143.48 |
| Daily Pivot Point R3 | 144.39 |
[/s2If]
Join Our Telegram Group
")


