#GBPUSD @ 1.21803 struggles to capitalize on its modest intraday gains to a nearly one-month high. (Pivot Orderbook analysis)
…
This is a premium post.
[s2If !current_user_can(access_s2member_level4)]Please register for PREMIUM VERSION HERE to read full post below containing analysis. In case of any error or you think you are not able to read the full post below, please email us at support#nehcap.com [lwa][/s2If] [s2If current_user_can(access_s2member_level4)]
- GBP/USD struggles to capitalize on its modest intraday gains to a nearly one-month high.
- A modest USD recovery attracts fresh sellers amid a bleak outlook for the UK economy.
- Bets for smaller Fed rate hikes could cap the greenback and lend support to the major.
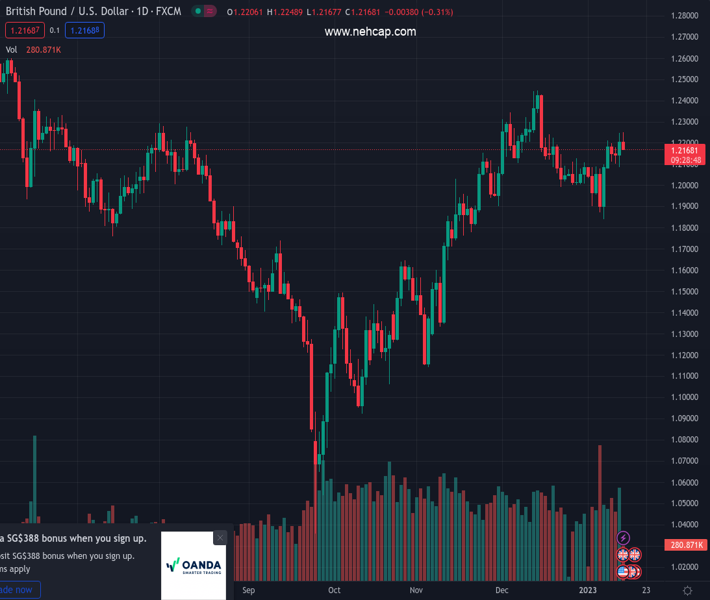
The pair currently trades last at 1.21803.
The previous day high was 1.2247 while the previous day low was 1.2088. The daily 38.2% Fib levels comes at 1.2186, expected to provide resistance. Similarly, the daily 61.8% fib level is at 1.2149, expected to provide support.
The GBP/USD pair retreats from nearly a one-month high, around mid-1.2200s set earlier this Friday and hits a fresh daily low during the mid-European session. Spot prices drop to the 1.2170 region in the last hour, reversing a part of the previous day’s positive move.
A combination of factors assists the US Dollar to stage a goodish recovery from its lowest level since June, which, in turn, attracts fresh sellers around the GBP/USD pair. An uptick in the US Treasury bond yields, along with a softer risk tone, help revive demand for the safe-haven greenback. The worst COVID-19 outbreak in China, which overshadows the optimism led by the country’s pivot away from its zero-COVID policy. Apart from this, the protracted Russia-Ukraine war has been fueling worries about a deeper global economic downturn and weighing on investors’ sentiment.
The GBP bulls, meanwhile, seem rather unimpressed by the better-than-expected UK monthly GDP print, which showed that the domestic economy posted a modest 0.1% growth in November. This, however, was largely offset by the disappointing release of the UK Manufacturing and Industrial Production figures. The data adds to a bleak outlook for the domestic economy and fuels speculations that the Bank of England (BoE) is nearing the end of the current rate-hiking cycle. This exerts additional downward pressure on the GBP/USD pair, though the downside seems limited, at least for now.
The UK consumer inflation figures released on Thursday reinforced market expectations that the Fed will soften its hawkish stance. Adding to this, several FOMC members backed the case for a smaller 25 bps rate hike in February. This might keep a lid on any meaningful upside for the US bond yields and act as a headwind for the greenback, warranting some caution before placing aggressive bearish bets around the GBP/USD pair. Market participants now look forward to the US economic docket, featuring the Preliminary Michigan Consumer Sentiment Index for a fresh trading impetus.
Technical Levels: Supports and Resistances
GBPUSD currently trading at 1.2177 at the time of writing. Pair opened at 1.2214 and is trading with a change of -0.3 % .
| Overview | Overview.1 | |
|---|---|---|
| 0 | Today last price | 1.2177 |
| 1 | Today Daily Change | -0.0037 |
| 2 | Today Daily Change % | -0.3000 |
| 3 | Today daily open | 1.2214 |
The pair remains strongly bullish on the daily timeframe. It trades above its 20 SMA @ 1.2084, 50 SMA 1.202, 100 SMA @ 1.1683 and 200 SMA @ 1.2001.
| Trends | Trends.1 | |
|---|---|---|
| 0 | Daily SMA20 | 1.2084 |
| 1 | Daily SMA50 | 1.2020 |
| 2 | Daily SMA100 | 1.1683 |
| 3 | Daily SMA200 | 1.2001 |
The previous day high was 1.2247 while the previous day low was 1.2088. The daily 38.2% Fib levels comes at 1.2186, expected to provide resistance. Similarly, the daily 61.8% fib level is at 1.2149, expected to provide support.
Note the levels of interest below:
- Pivot support is noted at 1.212, 1.2025, 1.1961
- Pivot resistance is noted at 1.2278, 1.2342, 1.2437
| Levels | Levels.1 |
|---|---|
| Previous Daily High | 1.2247 |
| Previous Daily Low | 1.2088 |
| Previous Weekly High | 1.2102 |
| Previous Weekly Low | 1.1841 |
| Previous Monthly High | 1.2447 |
| Previous Monthly Low | 1.1992 |
| Daily Fibonacci 38.2% | 1.2186 |
| Daily Fibonacci 61.8% | 1.2149 |
| Daily Pivot Point S1 | 1.2120 |
| Daily Pivot Point S2 | 1.2025 |
| Daily Pivot Point S3 | 1.1961 |
| Daily Pivot Point R1 | 1.2278 |
| Daily Pivot Point R2 | 1.2342 |
| Daily Pivot Point R3 | 1.2437 |
[/s2If]
Join Our Telegram Group
")


