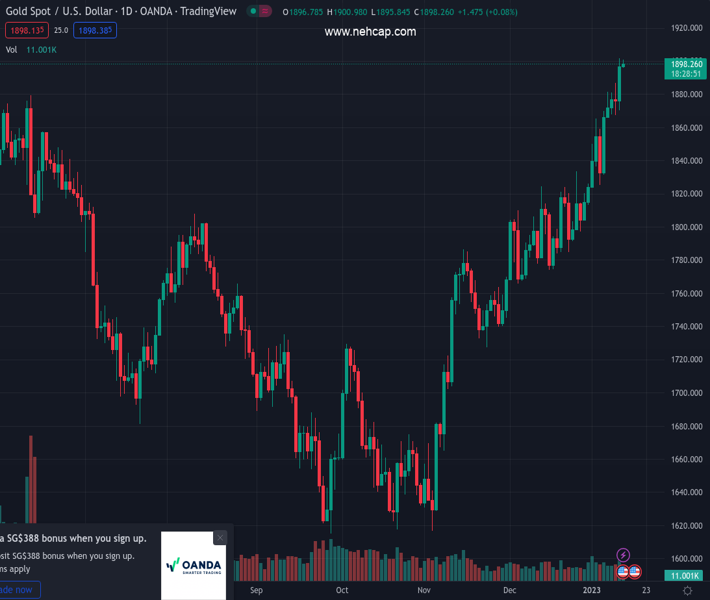
#XAUUSD @ 1,898.10 Gold price remains firmer around multi-month high, fades upside momentum of late.
…
This is a premium post.
[s2If !current_user_can(access_s2member_level4)]Please register for PREMIUM VERSION HERE to read full post below containing analysis. In case of any error or you think you are not able to read the full post below, please email us at support#nehcap.com [lwa][/s2If] [s2If current_user_can(access_s2member_level4)]
- Gold price remains firmer around multi-month high, fades upside momentum of late.
- Challenges to sentiment, market’s post-inflation consolidation probe XAU/USD bulls.
- Further upside hinges on successful break of $1,918 and more clues for Fed’s next moves.
Gold price (XAU/USD) stabilizes after refreshing the eight-month high as traders seek more clues to defend the weekly rally, the fourth one in a row. Also likely to have weighed the Gold price could be the trade-related fears surrounding China and the Federal Reserve (Fed) policymakers’ hesitance in backing the pivot talks. It’s worth noting, however, that the Fed talks signaled easy rate hikes after a downbeat US Consumer Price Index (CPI) and propelled the XAU/USD prices the previous day. That said, additional US consumer-centric data, like Michigan Consumer Sentiment Index and Retail Sales, eyed to confirm the recent bullish bias over the precious metal.
Also read: Gold Price Forecast: XAU/USD bulls need validation from $1,902 and US inflation expectations
The Technical Confluence Detector shows that the gold price is gathering pace around the $1,900 key hurdle, where the pivot point one-week R2 and Bollinger Band 15-minute Upper merge.
The XAU/USD upside past $1,900 could aim for the $1,917-18 resistance confluence where pivot point one-month R3 acts as the last defense of the Gold bears, a break of which could quickly propel prices to a late March 2022 peak surrounding $1,965.
That said, the pivot-point one-day R1, near $1,910, also acts as an upside filter for the Gold price.
Alternatively, the upper Bollinger Band on one-day joins the Fibonacci 23.6% on one-day to highlight $1,896 as nearby key support.
Following that, a slump towards the $1,881 key level, encompassing the Fibonacci 61.8% on one-day and pivot-point one-week R1, can’t be ruled out.
In a case where the Gold price remains bearish past $1,881, the pivot-point one-month R2, close to $1,875, will act as the last defense of XAU/USD bulls.
Overall, the Gold price remains on the bull’s radar unless breaking $1,875. However, the road towards the north isn’t smooth.
The TCD (Technical Confluences Detector) is a tool to locate and point out those price levels where there is a congestion of indicators, moving averages, Fibonacci levels, Pivot Points, etc. If you are a short-term trader, you will find entry points for counter-trend strategies and hunt a few points at a time. If you are a medium-to-long-term trader, this tool will allow you to know in advance the price levels where a medium-to-long-term trend may stop and rest, where to unwind positions, or where to increase your position size.
[/s2If]
Join Our Telegram Group
")


