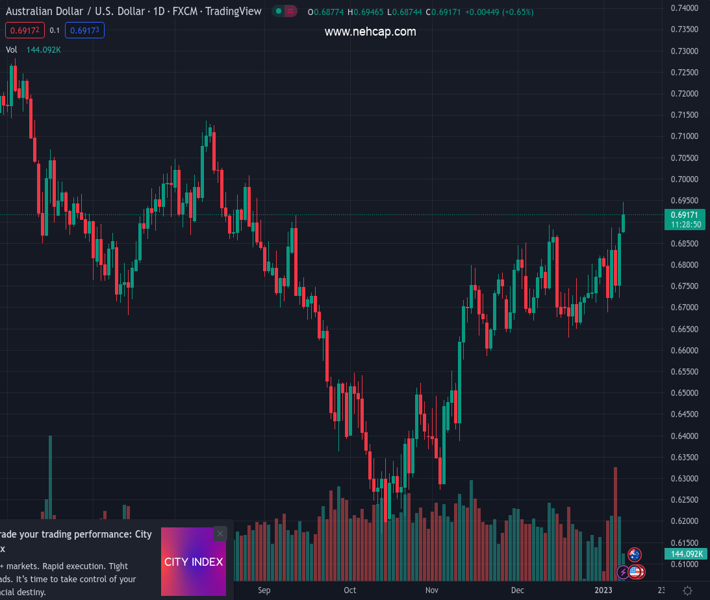
#AUDUSD @ 0.69170 gains traction for the second straight day and rallies to its highest level since late August. (Pivot Orderbook analysis)
…
This is a premium post.
[s2If !current_user_can(access_s2member_level4)]Please register for PREMIUM VERSION HERE to read full post below containing analysis. In case of any error or you think you are not able to read the full post below, please email us at support#nehcap.com [lwa][/s2If] [s2If current_user_can(access_s2member_level4)]
- AUD/USD gains traction for the second straight day and rallies to its highest level since late August.
- A combination of factors weighs heavily on the greenback and remains supportive of the move up.
- Looming recession risks might hold back bulls from placing fresh bets and cap any further gains.
The pair currently trades last at 0.69170.
The previous day high was 0.6887 while the previous day low was 0.6722. The daily 38.2% Fib levels comes at 0.6824, expected to provide support. Similarly, the daily 61.8% fib level is at 0.6785, expected to provide support.
The AUD/USD pair builds on Friday’s strong rally and gains strong follow-through traction on the first day of a new week. This marks the second successive day of a positive move and lifts spot prices closer to mid-0.6900s, or the highest since late August during the first half of the European session.
A combination of factors continues to weigh heavily on the US Dollar, which, in turn, is seen acting as a tailwind for the AUD/USD pair. The mixed US monthly jobs report (NFP) and the disappointing release of the US ISM Services PMI on Friday fueled speculations that the Fed will soften its hawkish stance. In fact, the markets are now pricing in a 25 bps Fed rate hike move in February. This leads to a further decline in the US Treasury bond yields and undermines the buck. Apart from this, the upbeat market mood exerts additional pressure on the safe-haven greenback and benefits the risk-sensitive Australian Dollar.
China pivoted away from the strict zero-COVID policy and opened its borders over the weekend for the first time in three years. This, in turn, boosted investors’ confidence, is evident from a generally positive tone around the equity markets and is seen denting the USD’s relative safe-haven status. That said, worries that the massive flow of Chinese travellers may cause another surge in COVID infections might keep a lid on any further optimism in the markets. Apart from this, the protracted Russia-Ukraine war, along with concerns about a deeper global economic downturn, could lend some support to the buck and cap the AUD/USD pair.
Traders might also refrain from placing aggressive bets and prefer to move to the sidelines ahead of the release of the high-anticipated US consumer inflation figures on Thursday. The crucial US CPI could influence the US central bank’s near-term policy outlook and provide a fresh directional impetus to the greenback. Nevertheless, sustained strength and acceptance above the 0.6890-0.6900 region support prospects for a further appreciating move for the AUD/USD pair. Hence, any meaningful pullback could be seen as a buying opportunity and remain limited.
Technical Levels: Supports and Resistances
AUDUSD currently trading at 0.6918 at the time of writing. Pair opened at 0.6884 and is trading with a change of 0.49 % .
| Overview | Overview.1 | |
|---|---|---|
| 0 | Today last price | 0.6918 |
| 1 | Today Daily Change | 0.0034 |
| 2 | Today Daily Change % | 0.4900 |
| 3 | Today daily open | 0.6884 |
The pair remains strongly bullish on the daily timeframe. It trades above its 20 SMA @ 0.6755, 50 SMA 0.6684, 100 SMA @ 0.6635 and 200 SMA @ 0.6846.
| Trends | Trends.1 | |
|---|---|---|
| 0 | Daily SMA20 | 0.6755 |
| 1 | Daily SMA50 | 0.6684 |
| 2 | Daily SMA100 | 0.6635 |
| 3 | Daily SMA200 | 0.6846 |
The previous day high was 0.6887 while the previous day low was 0.6722. The daily 38.2% Fib levels comes at 0.6824, expected to provide support. Similarly, the daily 61.8% fib level is at 0.6785, expected to provide support.
Note the levels of interest below:
- Pivot support is noted at 0.6775, 0.6666, 0.661
- Pivot resistance is noted at 0.694, 0.6996, 0.7104
| Levels | Levels.1 |
|---|---|
| Previous Daily High | 0.6887 |
| Previous Daily Low | 0.6722 |
| Previous Weekly High | 0.6887 |
| Previous Weekly Low | 0.6688 |
| Previous Monthly High | 0.6893 |
| Previous Monthly Low | 0.6629 |
| Daily Fibonacci 38.2% | 0.6824 |
| Daily Fibonacci 61.8% | 0.6785 |
| Daily Pivot Point S1 | 0.6775 |
| Daily Pivot Point S2 | 0.6666 |
| Daily Pivot Point S3 | 0.6610 |
| Daily Pivot Point R1 | 0.6940 |
| Daily Pivot Point R2 | 0.6996 |
| Daily Pivot Point R3 | 0.7104 |
[/s2If]
Join Our Telegram Group


