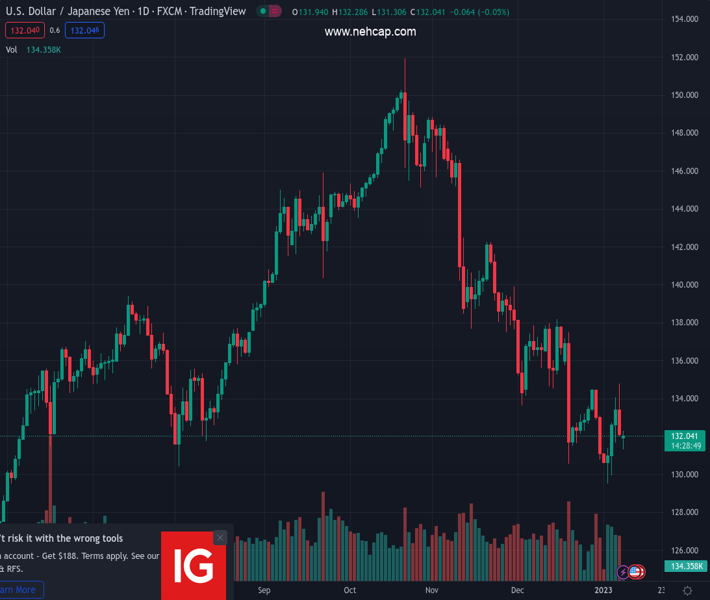
#USDJPY @ 131.957 oscillates in a narrow trading band on the first day of a new week. (Pivot Orderbook analysis)
…
This is a premium post.
[s2If !current_user_can(access_s2member_level4)]Please register for PREMIUM VERSION HERE to read full post below containing analysis. In case of any error or you think you are not able to read the full post below, please email us at support#nehcap.com [lwa][/s2If] [s2If current_user_can(access_s2member_level4)]
- USD/JPY oscillates in a narrow trading band on the first day of a new week.
- The prevalent USD selling bias is seen as acting as a headwind for the major.
- The risk-on mood undermines the safe-haven JPY and limits the downside.
The pair currently trades last at 131.957.
The previous day high was 134.78 while the previous day low was 131.99. The daily 38.2% Fib levels comes at 133.06, expected to provide resistance. Similarly, the daily 61.8% fib level is at 133.71, expected to provide resistance.
The USD/JPY pair struggles to gain any meaningful traction on the first day of a new week and seesaws between tepid gains/minor losses through the early European session. The pair is currently placed just below the 132.00 round-figure mark and seems vulnerable to extending Friday’s retracement slide from over a one-week high.
The US Dollar adds to Friday’s softer US macro data-inspired losses, which, in turn, is seen as a key factor acting as a headwind for the USD/JPY pair. In fact, the closely-watched US monthly jobs report (NFP) showed that Average Hourly Earnings grew 0.3% last month, lowering the YoY rise to 4.6% from 4.8% in November. This was seen as an indication that inflation pressures could be weakening.
Furthermore, the US ISM Services PMI fell into contraction territory and hit the worst level since 2009, fueling expectations for a less aggressive policy tightening by the Fed. This leads to an extension of the downfall in the US Treasury bond yields, which continues to weigh on the buck. That said, the risk-on impulse undermines the safe-haven Japanese Yen and acts as a tailwind for the USD/JPY pair.
China’s biggest pivot away from its strict zero-COVID policy boosts investors’ confidence, which is evident from a generally positive tone around the equity markets. The latest optimism, however, is likely to remain limited amid concerns that the massive flow of Chinese travellers may cause another surge in COVID infections and worries about a deeper global economic downturn.
Moreover, the recent reports that the Bank of Japan (BoJ) plans to raise its inflation forecasts could lend support to the JPY. This, in turn, suggests that the path of least resistance for the USD/JPY pair is to the downside. Hence, any attempted recovery could be seen as a selling opportunity and runs the risk of fizzling out rather quickly in the absence of any relevant macro data from the US.
Technical Levels: Supports and Resistances
USDJPY currently trading at 131.73 at the time of writing. Pair opened at 132.1 and is trading with a change of -0.28 % .
| Overview | Overview.1 | |
|---|---|---|
| 0 | Today last price | 131.73 |
| 1 | Today Daily Change | -0.37 |
| 2 | Today Daily Change % | -0.28 |
| 3 | Today daily open | 132.10 |
The pair remains strongly bearish on the daily time frame. It trades below the 20 SMA @ 133.72, 50 SMA 138.02, 100 SMA @ 140.95 and 200 SMA @ 136.46.
| Trends | Trends.1 | |
|---|---|---|
| 0 | Daily SMA20 | 133.72 |
| 1 | Daily SMA50 | 138.02 |
| 2 | Daily SMA100 | 140.95 |
| 3 | Daily SMA200 | 136.46 |
The previous day high was 134.78 while the previous day low was 131.99. The daily 38.2% Fib levels comes at 133.06, expected to provide resistance. Similarly, the daily 61.8% fib level is at 133.71, expected to provide resistance.
Note the levels of interest below:
- Pivot support is noted at 131.14, 130.17, 128.35
- Pivot resistance is noted at 133.92, 135.74, 136.7
| Levels | Levels.1 |
|---|---|
| Previous Daily High | 134.78 |
| Previous Daily Low | 131.99 |
| Previous Weekly High | 134.78 |
| Previous Weekly Low | 129.51 |
| Previous Monthly High | 138.18 |
| Previous Monthly Low | 130.57 |
| Daily Fibonacci 38.2% | 133.06 |
| Daily Fibonacci 61.8% | 133.71 |
| Daily Pivot Point S1 | 131.14 |
| Daily Pivot Point S2 | 130.17 |
| Daily Pivot Point S3 | 128.35 |
| Daily Pivot Point R1 | 133.92 |
| Daily Pivot Point R2 | 135.74 |
| Daily Pivot Point R3 | 136.70 |
[/s2If]
Join Our Telegram Group


