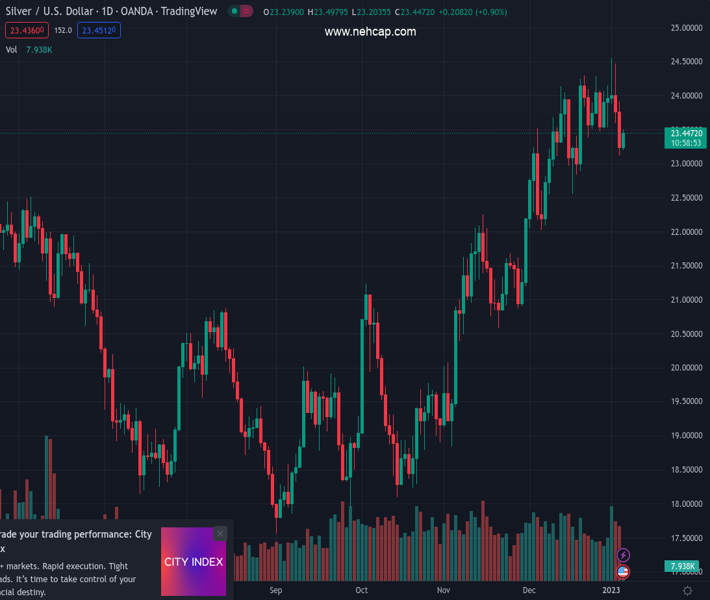
#XAGUSD @ 23.443 Silver regains some positive traction and snaps a three-day losing streak to a two-week low. (Pivot Orderbook analysis)
…
This is a premium post.
[s2If !current_user_can(access_s2member_level4)]Please register for PREMIUM VERSION HERE to read full post below containing analysis. In case of any error or you think you are not able to read the full post below, please email us at support#nehcap.com [lwa][/s2If] [s2If current_user_can(access_s2member_level4)]
- Silver regains some positive traction and snaps a three-day losing streak to a two-week low.
- The technical setup favours support prospects for the emergence of selling at higher levels.
- Any subsequent move up might still be seen as a selling opportunity and fizzle out quickly.
The pair currently trades last at 23.443.
The previous day high was 23.92 while the previous day low was 23.12. The daily 38.2% Fib levels comes at 23.42, expected to provide support. Similarly, the daily 61.8% fib level is at 23.61, expected to provide resistance.
Silver attracts some buying on Friday and reverses a part of the previous day’s losses to the $23.00 neighbourhood, or a two-week low. The white metal sticks to intraday gains, just below mid-$23.00s through the first half of the European session and for now, seems to have stalled this week’s pullback from over an eight-month high.
The technical setup, however, still seems tilted in favour of bearish traders, warranting some caution before positioning for any further intraday positive move. This week’s break below a two-month-old ascending trend line and a subsequent slide below the 200-period SMA on the 4-hour chart validates the negative outlook. Furthermore, oscillators on the daily chart have been losing momentum and support prospects for the emergence of fresh selling at higher levels.
Hence, any subsequent move up is more likely to meet with a fresh supply near the $23.70 area, or the 200-period SMA on the 4-hour chart. This, in turn, should cap the XAG/USD near the aforementioned ascending trend-line support breakpoint, now turned resistance, around the $23.90-$24.00 zone. The latter coincides with the overnight swing high and should act as a pivotal point, which if cleared decisively might prompt some short-covering around the white metal.
The XAG/USD might then aim to surpass an intermediate resistance near the $24.25 area, which is followed by the multi-month high, around the $24.50-$24.55 region set on Tuesday. A sustained strength beyond the latter will negate any near-term negative outlook and allow bulls to reclaim the $25.00 psychological mark for the first time since April 2022.
On the flip side, the $23.20-$23.10 area now seems to have emerged as immediate support. Some follow-through selling below the $23.00 round figure could drag the XAG/USD towards the $22.60-$22.55 region en route to the next relevant support near the $22.10-$22.00 horizontal zone. Failure to defend the said support levels will be seen as a fresh trigger for bearish traders and set the stage for a further near-term depreciating move.
Technical Levels: Supports and Resistances
XAGUSD currently trading at 23.42 at the time of writing. Pair opened at 23.24 and is trading with a change of 0.77 % .
| Overview | Overview.1 | |
|---|---|---|
| 0 | Today last price | 23.42 |
| 1 | Today Daily Change | 0.18 |
| 2 | Today Daily Change % | 0.77 |
| 3 | Today daily open | 23.24 |
The pair is trading below its 20 Daily moving average @ 23.66, above its 50 Daily moving average @ 22.22 , above its 100 Daily moving average @ 20.66 and above its 200 Daily moving average @ 21.1
| Trends | Trends.1 | |
|---|---|---|
| 0 | Daily SMA20 | 23.66 |
| 1 | Daily SMA50 | 22.22 |
| 2 | Daily SMA100 | 20.66 |
| 3 | Daily SMA200 | 21.10 |
The previous day high was 23.92 while the previous day low was 23.12. The daily 38.2% Fib levels comes at 23.42, expected to provide support. Similarly, the daily 61.8% fib level is at 23.61, expected to provide resistance.
Note the levels of interest below:
- Pivot support is noted at 22.93, 22.62, 22.13
- Pivot resistance is noted at 23.73, 24.22, 24.53
| Levels | Levels.1 |
|---|---|
| Previous Daily High | 23.92 |
| Previous Daily Low | 23.12 |
| Previous Weekly High | 24.28 |
| Previous Weekly Low | 23.46 |
| Previous Monthly High | 24.30 |
| Previous Monthly Low | 22.03 |
| Daily Fibonacci 38.2% | 23.42 |
| Daily Fibonacci 61.8% | 23.61 |
| Daily Pivot Point S1 | 22.93 |
| Daily Pivot Point S2 | 22.62 |
| Daily Pivot Point S3 | 22.13 |
| Daily Pivot Point R1 | 23.73 |
| Daily Pivot Point R2 | 24.22 |
| Daily Pivot Point R3 | 24.53 |
[/s2If]
Join Our Telegram Group


