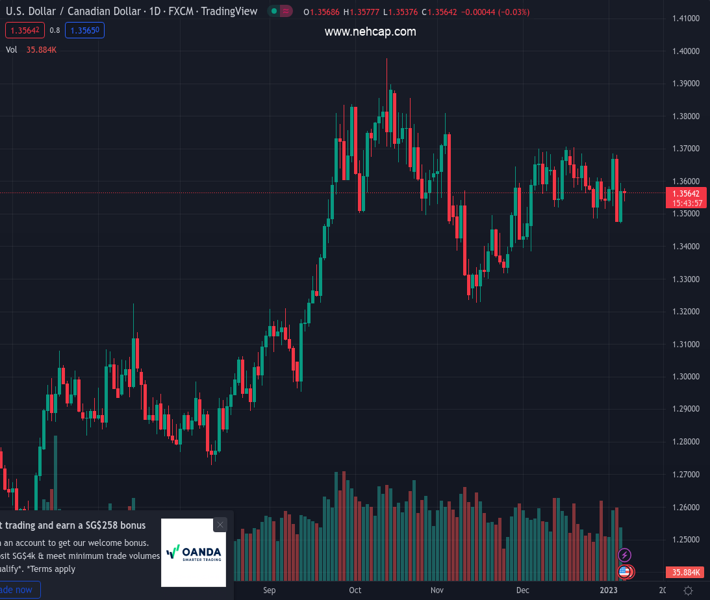
#USDCAD @ 1.35655 Advancing anxiety ahead of the US NFP release has underpinned the risk-off impulse. (Pivot Orderbook analysis)
…
This is a premium post.
[s2If !current_user_can(access_s2member_level4)]Please register for PREMIUM VERSION HERE to read full post below containing analysis. In case of any error or you think you are not able to read the full post below, please email us at support#nehcap.com [lwa][/s2If] [s2If current_user_can(access_s2member_level4)]
- Advancing anxiety ahead of the US NFP release has underpinned the risk-off impulse.
- S&P500 futures have witnessed a drop in their early gains, portraying negative market sentiment.
- The upside in the Loonie asset is capped around 1.3700 while the downside is restricted near 1.3500.
The pair currently trades last at 1.35655.
The previous day high was 1.3596 while the previous day low was 1.347. The daily 38.2% Fib levels comes at 1.3548, expected to provide support. Similarly, the daily 61.8% fib level is at 1.3518, expected to provide support.
The USD/CAD pair has rebounded firmly after dropping to near 1.3550 in the early European session. The Loonie asset has sensed a decent demand as traction has shifted in the favor of safe-haven assets. Also, the US Dollar Index (DXY) has scaled to near the crucial resistance of 105.00, at the time of writing, as anxiety among market participants has soared ahead of the release of the United States Nonfarm Payrolls (NFP) data.
Gains recorded in the S&P500 futures in early Asia have trimmed significantly as investors are preferring in avoiding positions in the US equities till the release of the employment data for making informed decisions.
A scrutiny of USD/CAD on a four-hour scale indicates that the upside of the asset is capped around the horizontal resistance plotted from December 7 high at 1.3700 while the downside is restricted around the demand zone placed in a 1.3480-1.3500 range. The 50-period Exponential Moving Average (EMA) at 1.3567 is overlapping with the Lonnie price, which indicates a rangebound structure.
Also, the Relative Strength Index (RSI) (14) is oscillating in a 40.00-60.00 range, which signifies that investors are waiting for a fresh trigger for making positions.
Going forward, a decisive break above the December 16 high around 1.3700 will strengthen the US Dollar and will drive the Loonie asset toward October 25 high at 1.3748 and November 3 high at 1.3808.
On the contrary, the major could drop to November 23 high at 1.3440 after surrendering the psychological support of 1.3500. Later on, a slippage below 1.3440 will expose the Loonie asset for more downside towards December 5 low at 1.3385.
Technical Levels: Supports and Resistances
USDCAD currently trading at 1.3572 at the time of writing. Pair opened at 1.3581 and is trading with a change of -0.07 % .
| Overview | Overview.1 | |
|---|---|---|
| 0 | Today last price | 1.3572 |
| 1 | Today Daily Change | -0.0009 |
| 2 | Today Daily Change % | -0.0700 |
| 3 | Today daily open | 1.3581 |
The pair is trading below its 20 Daily moving average @ 1.3598, above its 50 Daily moving average @ 1.3525 , above its 100 Daily moving average @ 1.3471 and above its 200 Daily moving average @ 1.3143
| Trends | Trends.1 | |
|---|---|---|
| 0 | Daily SMA20 | 1.3598 |
| 1 | Daily SMA50 | 1.3525 |
| 2 | Daily SMA100 | 1.3471 |
| 3 | Daily SMA200 | 1.3143 |
The previous day high was 1.3596 while the previous day low was 1.347. The daily 38.2% Fib levels comes at 1.3548, expected to provide support. Similarly, the daily 61.8% fib level is at 1.3518, expected to provide support.
Note the levels of interest below:
- Pivot support is noted at 1.3503, 1.3424, 1.3378
- Pivot resistance is noted at 1.3628, 1.3674, 1.3753
| Levels | Levels.1 |
|---|---|
| Previous Daily High | 1.3596 |
| Previous Daily Low | 1.3470 |
| Previous Weekly High | 1.3612 |
| Previous Weekly Low | 1.3484 |
| Previous Monthly High | 1.3705 |
| Previous Monthly Low | 1.3385 |
| Daily Fibonacci 38.2% | 1.3548 |
| Daily Fibonacci 61.8% | 1.3518 |
| Daily Pivot Point S1 | 1.3503 |
| Daily Pivot Point S2 | 1.3424 |
| Daily Pivot Point S3 | 1.3378 |
| Daily Pivot Point R1 | 1.3628 |
| Daily Pivot Point R2 | 1.3674 |
| Daily Pivot Point R3 | 1.3753 |
[/s2If]
Join Our Telegram Group


