A significant improvement in investors’ risk appetite backed the recovery in the Asian indices. (Pivot Orderbook analysis)
…
This is a premium post.
[s2If !current_user_can(access_s2member_level4)]Please register for PREMIUM VERSION HERE to read full post below containing analysis. In case of any error or you think you are not able to read the full post below, please email us at support#nehcap.com [lwa][/s2If] [s2If current_user_can(access_s2member_level4)]
- A significant improvement in investors’ risk appetite backed the recovery in the Asian indices.
- Asian equities to display a decisive move post the release of the US NFP data.
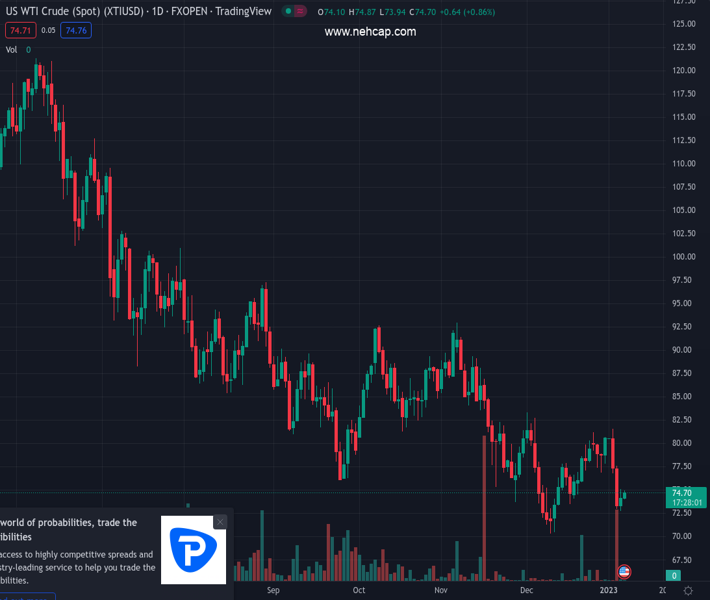
- Oil price continues its rangebound action despite an increase in weekly oil inventories.
The pair currently trades last at 25730.38.
The previous day high was 25873.72 while the previous day low was 25716.62. The daily 38.2% Fib levels comes at 25776.63, expected to provide resistance. Similarly, the daily 61.8% fib level is at 25813.71, expected to provide resistance.
Markets in the Asian domain have displayed a recovery move, shrugging off volatility witnessed in S&P500 on Thursday. Investors have accepted the fact that United States Nonfarm Payrolls (NFP) could display a stronger-than-anticipated performance after upbeat cues from the release of the Automatic Data Processing (ADP) Employment Change.
Analysts at Goldman Sachs see the first US Nonfarm Payrolls data release of 2023 at 225K+. The Unemployment Rate is seen unchanged at 3.7%.
At the press time, Japan’s Nikkei225 gained 0.70%, SZSE Component jumped 0.82%, Hang Seng climbed 0.66% and Nifty50 added 0.12%.
Investors are worried due to resilience in the United States job market as it would provide a genuine reason to the Federal Reserve (Fed) to keep the interest rates on an elevated note. The release of the Federal Open Market Committee (FOMC) minutes has already cleared that none of the Fed policymakers are expecting a consideration of an interest rate cut before CY2024. The street reacted significantly to the release of DP Employment Change data, however, the release of the official US employment data will provide more clarity on employment status.
Meanwhile, Chinese equities have picked strength amid China-Australia trade optimism. The Chinese economy is expected to wave off restrictions on imports of Australian commodities. Investors consider it a significant step from the Chinese administration to accelerate trade relations at times when it is reopening a full-fledged economy after a stretched lockdown period.
On the oil front, oil price has continued its sideways auction after a bloodbath recorded on Wednesday. In the Asian session, the black gold attempted to extend its recovery above the crucial resistance of $75.00. The oil price didn’t display any major gyration despite the US Energy Information Administration (EIA) reporting an increase in oil stockpiles by 1.694 million barrels for the week ending December 30.
Technical Levels: Supports and Resistances
XTIUSD currently trading at 25730.38 at the time of writing. Pair opened at 25730.38 and is trading with a change of 0.0 % .
| Overview | Overview.1 | |
|---|---|---|
| 0 | Today last price | 25730.38 |
| 1 | Today Daily Change | 0.00 |
| 2 | Today Daily Change % | 0.00 |
| 3 | Today daily open | 25730.38 |
The pair remains strongly bearish on the daily time frame. It trades below the 20 SMA @ 26685.91, 50 SMA 27399.83, 100 SMA @ 27413.35 and 200 SMA @ 27258.54.
| Trends | Trends.1 | |
|---|---|---|
| 0 | Daily SMA20 | 26685.91 |
| 1 | Daily SMA50 | 27399.83 |
| 2 | Daily SMA100 | 27413.35 |
| 3 | Daily SMA200 | 27258.54 |
The previous day high was 25873.72 while the previous day low was 25716.62. The daily 38.2% Fib levels comes at 25776.63, expected to provide resistance. Similarly, the daily 61.8% fib level is at 25813.71, expected to provide resistance.
Note the levels of interest below:
- Pivot support is noted at 25673.43, 25616.47, 25516.33
- Pivot resistance is noted at 25830.53, 25930.67, 25987.63
| Levels | Levels.1 |
|---|---|
| Previous Daily High | 25873.72 |
| Previous Daily Low | 25716.62 |
| Previous Weekly High | 26479.57 |
| Previous Weekly Low | 25793.22 |
| Previous Monthly High | 28325.89 |
| Previous Monthly Low | 25793.22 |
| Daily Fibonacci 38.2% | 25776.63 |
| Daily Fibonacci 61.8% | 25813.71 |
| Daily Pivot Point S1 | 25673.43 |
| Daily Pivot Point S2 | 25616.47 |
| Daily Pivot Point S3 | 25516.33 |
| Daily Pivot Point R1 | 25830.53 |
| Daily Pivot Point R2 | 25930.67 |
| Daily Pivot Point R3 | 25987.63 |
[/s2If]
Join Our Telegram Group


