#GBPUSD @ 1.19260 A mild recovery in S&P500 futures is indicating that the risk-on mood is attempting to regain traction. (Pivot Orderbook analysis)
…
This is a premium post.
[s2If !current_user_can(access_s2member_level4)]Please register for PREMIUM VERSION HERE to read full post below containing analysis. In case of any error or you think you are not able to read the full post below, please email us at support#nehcap.com [lwa][/s2If] [s2If current_user_can(access_s2member_level4)]
- A mild recovery in S&P500 futures is indicating that the risk-on mood is attempting to regain traction.
- A breakdown of an H&S chart pattern will result in the sheer downside ahead.
- The RSI (14) has slipped into the bearish range of 20.00-40.00, which indicates more weakness ahead.
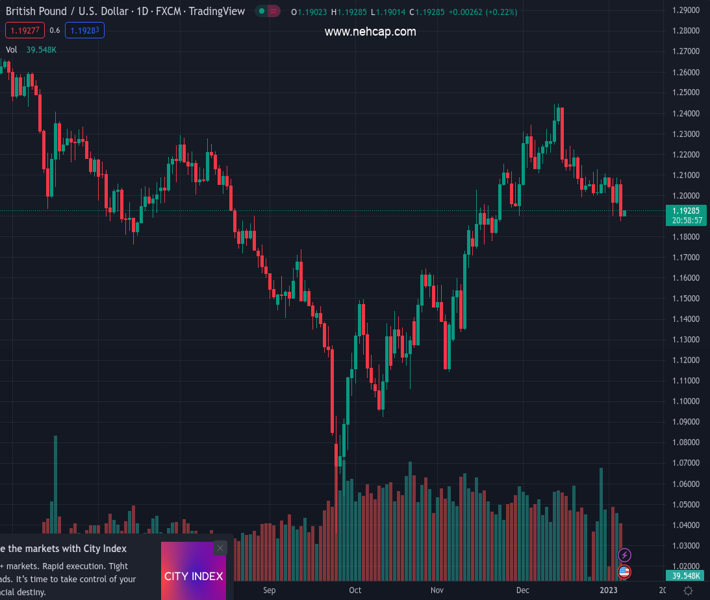
The pair currently trades last at 1.19260.
The previous day high was 1.2078 while the previous day low was 1.1873. The daily 38.2% Fib levels comes at 1.1952, expected to provide resistance. Similarly, the daily 61.8% fib level is at 1.2, expected to provide resistance.
The GBP/USD pair has sensed a temporary demand below the critical support of 1.1900 in the Asian session, however, the broader set of the risk profile is extremely negative. The Cable asset is likely to remain on the tenterhooks as stronger United States job market data has accelerated the odds of further policy tightening consideration by the Federal Reserve (Fed).
S&P500 futures have displayed a higher tick in early Asia after a massive sell-off on Thursday but still portraying caution before turning to risk-sensitive assets. The US Dollar Index (DXY) is expected to display a sideways action ahead of the release of the US Nonfarm Payrolls (NFP) data.
On a four-hour scale, the Cable is hovering near the neckline of the Head and Shoulder (H&S) chart pattern, which is plotted from December 29 low around 1.1900. The aforementioned chart pattern indicates a stretched inventory distribution, which results in volatility expansion after a breakdown.
Declining 20-and 50-period Exponential Moving Averages (EMAs) at 1.1990 and 1.2010 respectively add to the downside filters.
Also, the Relative Strength Index (RSI) (14) has slipped into the bearish range of 20.00-40.00, which indicates more weakness ahead.
Going forward, a slippage below Thursday’s low at 1.1873 will drag the major toward November 21 low around 1.1778. A slippage below the latter will expose Cable for more downside towards the round-level support at 1.1700.
On the flip side, the Pound Sterling needs to push the Cable decisively above December 27 high around 1.2100 for an upside move, which will drive the major towards December 21 high at 1.2147 followed by December 21 high around 1.2200.
Technical Levels: Supports and Resistances
GBPUSD currently trading at 1.1922 at the time of writing. Pair opened at 1.191 and is trading with a change of 0.1 % .
| Overview | Overview.1 | |
|---|---|---|
| 0 | Today last price | 1.1922 |
| 1 | Today Daily Change | 0.0012 |
| 2 | Today Daily Change % | 0.1000 |
| 3 | Today daily open | 1.1910 |
The pair is trading below its 20 Daily moving average @ 1.2119, below its 50 Daily moving average @ 1.1947 , above its 100 Daily moving average @ 1.1666 and below its 200 Daily moving average @ 1.2024
| Trends | Trends.1 | |
|---|---|---|
| 0 | Daily SMA20 | 1.2119 |
| 1 | Daily SMA50 | 1.1947 |
| 2 | Daily SMA100 | 1.1666 |
| 3 | Daily SMA200 | 1.2024 |
The previous day high was 1.2078 while the previous day low was 1.1873. The daily 38.2% Fib levels comes at 1.1952, expected to provide resistance. Similarly, the daily 61.8% fib level is at 1.2, expected to provide resistance.
Note the levels of interest below:
- Pivot support is noted at 1.1829, 1.1749, 1.1624
- Pivot resistance is noted at 1.2034, 1.2159, 1.2239
| Levels | Levels.1 |
|---|---|
| Previous Daily High | 1.2078 |
| Previous Daily Low | 1.1873 |
| Previous Weekly High | 1.2126 |
| Previous Weekly Low | 1.2002 |
| Previous Monthly High | 1.2447 |
| Previous Monthly Low | 1.1992 |
| Daily Fibonacci 38.2% | 1.1952 |
| Daily Fibonacci 61.8% | 1.2000 |
| Daily Pivot Point S1 | 1.1829 |
| Daily Pivot Point S2 | 1.1749 |
| Daily Pivot Point S3 | 1.1624 |
| Daily Pivot Point R1 | 1.2034 |
| Daily Pivot Point R2 | 1.2159 |
| Daily Pivot Point R3 | 1.2239 |
[/s2If]
Join Our Telegram Group


