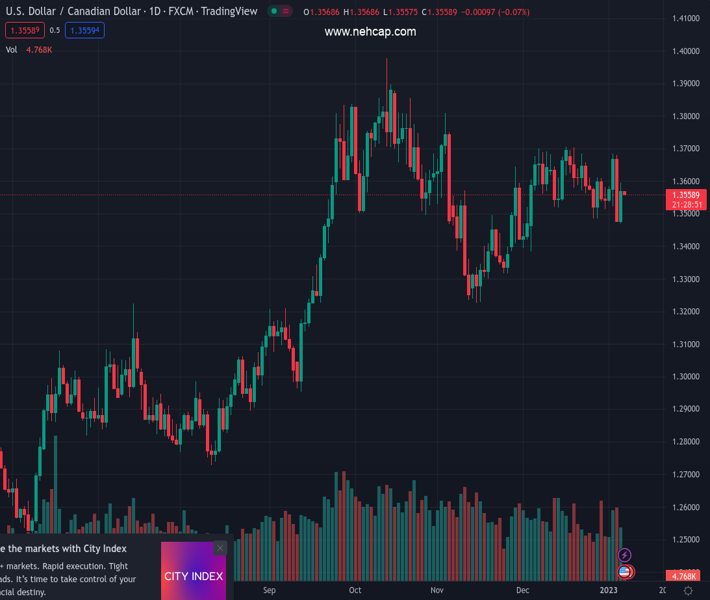
#USDCAD @ 1.35583 struggles to find direction as investors seek Canadian employment data for fresh cues. (Pivot Orderbook analysis)
…
This is a premium post.
[s2If !current_user_can(access_s2member_level4)]Please register for PREMIUM VERSION HERE to read full post below containing analysis. In case of any error or you think you are not able to read the full post below, please email us at support#nehcap.com [lwa][/s2If] [s2If current_user_can(access_s2member_level4)]
- USD/CAD struggles to find direction as investors seek Canadian employment data for fresh cues.
- A resilient US labor market is likely to support the Fed’s decision of hawkish policy continuation for a longer period.
- Canada’s Employment Change for December is seen lower at 8K against 10.1K released earlier.
The pair currently trades last at 1.35583.
The previous day high was 1.3596 while the previous day low was 1.347. The daily 38.2% Fib levels comes at 1.3548, expected to provide support. Similarly, the daily 61.8% fib level is at 1.3518, expected to provide support.
The USD/CAD pair is oscillating in a narrow range of 1.3560-1.3580 in the early Asian session. The Loonie asset has turned sideways after a rally from the psychological support of 1.3500. The US Dollar witnessed firmer strength from the market participants after the upbeat United States Automatic Data Processing (ADP) Employment Change data triggered a risk-aversion theme.
The US Dollar Index (DXY) soared to the crucial resistance of 105.00 as accelerating expectations of a secular hawkish monetary policy by the Federal Reserve (Fed) improved the safe-haven’s appeal. Also, it provided support for the 10-year US Treasury yields and pushed them above 3.72%. Meanwhile, S&P500 futures have picked some demand after a sell-off on Thursday, portraying a minor recovery in investors’ risk appetite.
As per the US ADP agency, the United States economy has generated employment for 235K job aspirants against the consensus of 150K. No doubt, firmer labor demand shows strength in an economy but in times of red-hot inflation it provides a meaningful reason to the Fed for avoiding consideration of interest rate cut-approach in the near time.
For more clarity on the status of the US labor market, investors will scrutinize the release of the US Nonfarm Payrolls (NFP) data, which will release on Friday.
Meanwhile, the Canadian Dollar will also display action on the release of the Employment data. According to the estimates, net addition in payrolls for December stands at 8K against 10.1K released earlier. The Unemployment rate may escalate marginally to 5.2%.
On the oil front, the oil price is displaying a rangebound action ahead of the release of the official US Employment data. The black gold could pick strength as the Covid-19 situation might find its peak sooner. It is worth noting that Canada is a leading exporter of oil to the US and higher oil prices support the Canadian Dollar.
Technical Levels: Supports and Resistances
USDCAD currently trading at 1.3561 at the time of writing. Pair opened at 1.3581 and is trading with a change of -0.15 % .
| Overview | Overview.1 | |
|---|---|---|
| 0 | Today last price | 1.3561 |
| 1 | Today Daily Change | -0.0020 |
| 2 | Today Daily Change % | -0.1500 |
| 3 | Today daily open | 1.3581 |
The pair is trading below its 20 Daily moving average @ 1.3598, above its 50 Daily moving average @ 1.3525 , above its 100 Daily moving average @ 1.3471 and above its 200 Daily moving average @ 1.3143
| Trends | Trends.1 | |
|---|---|---|
| 0 | Daily SMA20 | 1.3598 |
| 1 | Daily SMA50 | 1.3525 |
| 2 | Daily SMA100 | 1.3471 |
| 3 | Daily SMA200 | 1.3143 |
The previous day high was 1.3596 while the previous day low was 1.347. The daily 38.2% Fib levels comes at 1.3548, expected to provide support. Similarly, the daily 61.8% fib level is at 1.3518, expected to provide support.
Note the levels of interest below:
- Pivot support is noted at 1.3503, 1.3424, 1.3378
- Pivot resistance is noted at 1.3628, 1.3674, 1.3753
| Levels | Levels.1 |
|---|---|
| Previous Daily High | 1.3596 |
| Previous Daily Low | 1.3470 |
| Previous Weekly High | 1.3612 |
| Previous Weekly Low | 1.3484 |
| Previous Monthly High | 1.3705 |
| Previous Monthly Low | 1.3385 |
| Daily Fibonacci 38.2% | 1.3548 |
| Daily Fibonacci 61.8% | 1.3518 |
| Daily Pivot Point S1 | 1.3503 |
| Daily Pivot Point S2 | 1.3424 |
| Daily Pivot Point S3 | 1.3378 |
| Daily Pivot Point R1 | 1.3628 |
| Daily Pivot Point R2 | 1.3674 |
| Daily Pivot Point R3 | 1.3753 |
[/s2If]
Join Our Telegram Group


