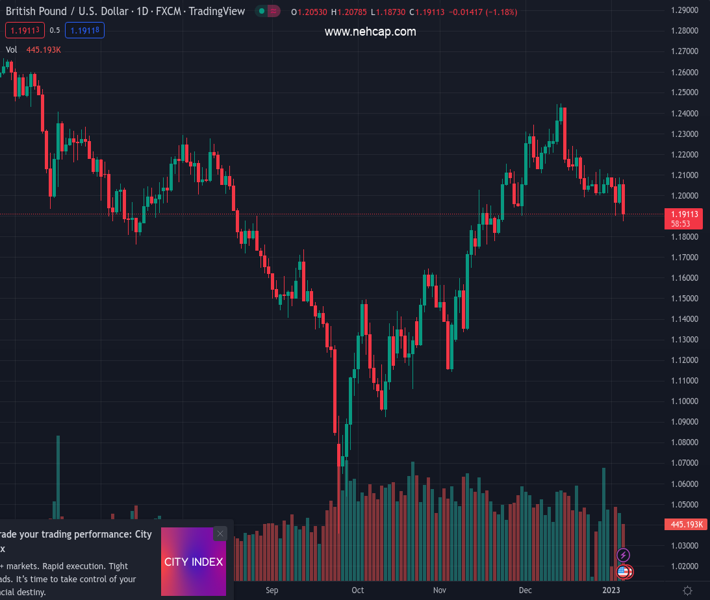
#GBPUSD @ 1.19117 Economic data in the United States strengthened the US Dollar vs. the Pound Sterling. (Pivot Orderbook analysis)
…
This is a premium post.
[s2If !current_user_can(access_s2member_level4)]Please register for PREMIUM VERSION HERE to read full post below containing analysis. In case of any error or you think you are not able to read the full post below, please email us at support#nehcap.com [lwa][/s2If] [s2If current_user_can(access_s2member_level4)]
- Economic data in the United States strengthened the US Dollar vs. the Pound Sterling.
- Fed speakers remained worried about inflation, with some expecting rates at around 5% in 2024.
- GBP/USD traders are eyeing December’s US Nonfarm Payrolls data.
The pair currently trades last at 1.19117.
The previous day high was 1.2088 while the previous day low was 1.1958. The daily 38.2% Fib levels comes at 1.2038, expected to provide resistance. Similarly, the daily 61.8% fib level is at 1.2007, expected to provide resistance.
The GBP/USD plummets from 1.2078 daily highs toward the 1.1910s area on broad US Dollar (USD) strength triggered by solid labor market data. Wall Street is set to register losses, portraying investors’ dampened mood. At the time of writing, the GBP/USD is trading at 1.1912.
The Pound Sterling (GBP) continued to weaken as the New York session is about to end. ADP’s Employment Change report for December displayed that private hiring 234K more people than the 150K estimated, spurring speculations that Friday’s US Nonfarm Payrolls report could be the spark for a 50 bps rate hike by the Federal Reserve (Fed) on February 1.
Furthermore, the US labor department revealed that Initial Jobless Claims for the week ending December 31 dropped to 204K, lower than street analysts’ 225K mark estimates, while Continuing claims shrank to 1.694M less than the 1.708M expected.
Another reason that triggered a leg-down in the GBP/USD is Fed speaking. Kansas City Fed President Esther George said that inflation remains high and that rates need to be above 5% at least until 2024. Later, Atlanta’s Fed President Raphael Bostic stated that inflation is the biggest headwind for the US economy.
Of late, St. Louis Fed President said that it would be good for the Fed to get to a restrictive stance quickly. Bullard added that the job market remains strong and would justify Fed’s aggression. To finalize, he added that GDP is likely to moderate at a 2% pace in 2023 and that inflation would ease slower than the market’s estimates.
Ahead into the week, with the GBP/USD pair trading at around the 1.1910s area, traders would be focused on the UK’s S&P Global/CIPS ConstructionPMI alongside the House Price Index. Regarding the United States (US) calendar, the docket will feature the US Nonfarm Payrolls report for December.
Technical Levels: Supports and Resistances
GBPUSD currently trading at 1.191 at the time of writing. Pair opened at 1.2059 and is trading with a change of -1.24 % .
| Overview | Overview.1 | |
|---|---|---|
| 0 | Today last price | 1.1910 |
| 1 | Today Daily Change | -0.0149 |
| 2 | Today Daily Change % | -1.2400 |
| 3 | Today daily open | 1.2059 |
The pair is trading below its 20 Daily moving average @ 1.2136, below its 50 Daily moving average @ 1.194 , above its 100 Daily moving average @ 1.1666 and below its 200 Daily moving average @ 1.203
| Trends | Trends.1 | |
|---|---|---|
| 0 | Daily SMA20 | 1.2136 |
| 1 | Daily SMA50 | 1.1940 |
| 2 | Daily SMA100 | 1.1666 |
| 3 | Daily SMA200 | 1.2030 |
The previous day high was 1.2088 while the previous day low was 1.1958. The daily 38.2% Fib levels comes at 1.2038, expected to provide resistance. Similarly, the daily 61.8% fib level is at 1.2007, expected to provide resistance.
Note the levels of interest below:
- Pivot support is noted at 1.1982, 1.1905, 1.1852
- Pivot resistance is noted at 1.2112, 1.2165, 1.2242
| Levels | Levels.1 |
|---|---|
| Previous Daily High | 1.2088 |
| Previous Daily Low | 1.1958 |
| Previous Weekly High | 1.2126 |
| Previous Weekly Low | 1.2002 |
| Previous Monthly High | 1.2447 |
| Previous Monthly Low | 1.1992 |
| Daily Fibonacci 38.2% | 1.2038 |
| Daily Fibonacci 61.8% | 1.2007 |
| Daily Pivot Point S1 | 1.1982 |
| Daily Pivot Point S2 | 1.1905 |
| Daily Pivot Point S3 | 1.1852 |
| Daily Pivot Point R1 | 1.2112 |
| Daily Pivot Point R2 | 1.2165 |
| Daily Pivot Point R3 | 1.2242 |
[/s2If]
Join Our Telegram Group


