#USDCHF @ 0.93556 climbs steadily, bolstered by US economic data and speculation for further Fed tightening. (Pivot Orderbook analysis)
…
This is a premium post.
[s2If !current_user_can(access_s2member_level4)]Please register for PREMIUM VERSION HERE to read full post below containing analysis. In case of any error or you think you are not able to read the full post below, please email us at support#nehcap.com [lwa][/s2If] [s2If current_user_can(access_s2member_level4)]
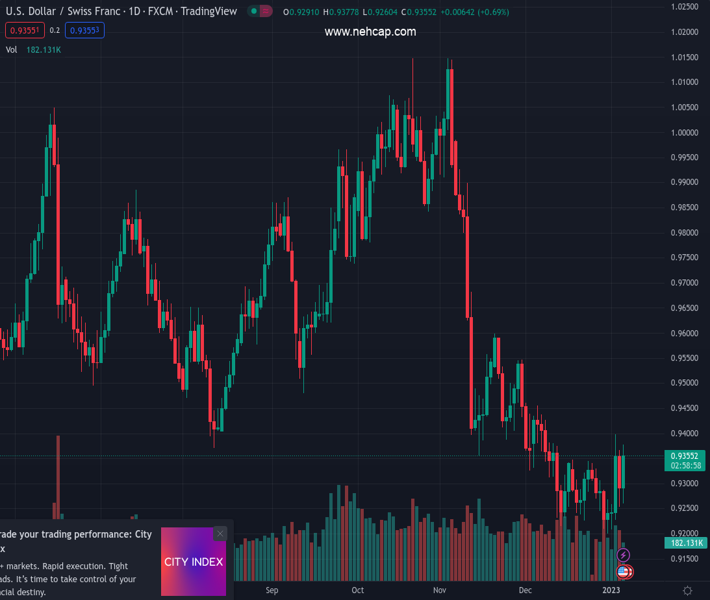
- USD/CHF climbs steadily, bolstered by US economic data and speculation for further Fed tightening.
- The USD/CHF pairs bounced at around a top-trendline of a falling wedge which turned support around 0.9250.
- A daily close above 0.9366 could send the USD/CHF rallying towards 0.9400 and beyond.
The pair currently trades last at 0.93556.
The previous day high was 0.9375 while the previous day low was 0.9253. The daily 38.2% Fib levels comes at 0.93, expected to provide support. Similarly, the daily 61.8% fib level is at 0.9328, expected to provide support.
The USD/CHF erases Wednesday’s losses and rises more than 70 pips on Thursday, clearing on its way north solid resistance levels, like the 20-day Exponential Moving Average (EMA) at 0.9322. Factors like the release of robust labor market data in the United States (US) lifted the USD/CHF from around daily lows of 0.9260. At the time of writing, the USD/CHF is trading at 0.9360.
After finding support at around 0.9200, the USD/CHF resumed its uptrend, eyeing a break above Wednesday’s daily high of 0.9366. The USD/CHF dropped towards the top-trend line of a falling wedge, previously broken during the week, turned support. Hence, the major bounced at around 0.9250 and aimed toward a downslope resistance trendline that passed around 0.9370.
If the USD/CHF achieves a daily close above 0.9366, that could open the door for further upside, implying a test of the 0.9400 mark, which, once cleared, would send the USD/CHF aiming towards the 100-day EMA at 0.9445, followed by a test of 0.9500.
As an alternate scenario, the USD/CHF first support would be the 20-day EMA at 0.9322, followed by the 0.9300 figure and the top trendline of a falling wedge that resides around 0.9250.
Technical Levels: Supports and Resistances
USDCHF currently trading at 0.9355 at the time of writing. Pair opened at 0.93 and is trading with a change of 0.59 % .
| Overview | Overview.1 | |
|---|---|---|
| 0 | Today last price | 0.9355 |
| 1 | Today Daily Change | 0.0055 |
| 2 | Today Daily Change % | 0.5900 |
| 3 | Today daily open | 0.9300 |
The pair is trading above its 20 Daily moving average @ 0.9301, below its 50 Daily moving average @ 0.9499 , below its 100 Daily moving average @ 0.9649 and below its 200 Daily moving average @ 0.9644
| Trends | Trends.1 | |
|---|---|---|
| 0 | Daily SMA20 | 0.9301 |
| 1 | Daily SMA50 | 0.9499 |
| 2 | Daily SMA100 | 0.9649 |
| 3 | Daily SMA200 | 0.9644 |
The previous day high was 0.9375 while the previous day low was 0.9253. The daily 38.2% Fib levels comes at 0.93, expected to provide support. Similarly, the daily 61.8% fib level is at 0.9328, expected to provide support.
Note the levels of interest below:
- Pivot support is noted at 0.9244, 0.9188, 0.9122
- Pivot resistance is noted at 0.9365, 0.9431, 0.9487
| Levels | Levels.1 |
|---|---|
| Previous Daily High | 0.9375 |
| Previous Daily Low | 0.9253 |
| Previous Weekly High | 0.9338 |
| Previous Weekly Low | 0.9201 |
| Previous Monthly High | 0.9471 |
| Previous Monthly Low | 0.9201 |
| Daily Fibonacci 38.2% | 0.9300 |
| Daily Fibonacci 61.8% | 0.9328 |
| Daily Pivot Point S1 | 0.9244 |
| Daily Pivot Point S2 | 0.9188 |
| Daily Pivot Point S3 | 0.9122 |
| Daily Pivot Point R1 | 0.9365 |
| Daily Pivot Point R2 | 0.9431 |
| Daily Pivot Point R3 | 0.9487 |
[/s2If]
Join Our Telegram Group


