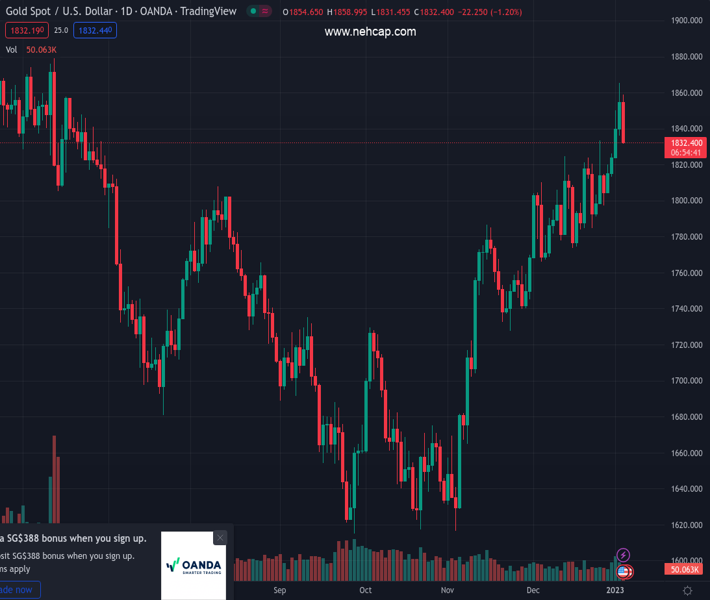
#XAUUSD @ 1,832.53 US Dollar strengthens across the board after US economic data. (Pivot Orderbook analysis)
…
This is a premium post.
[s2If !current_user_can(access_s2member_level4)]Please register for PREMIUM VERSION HERE to read full post below containing analysis. In case of any error or you think you are not able to read the full post below, please email us at support#nehcap.com [lwa][/s2If] [s2If current_user_can(access_s2member_level4)]
- US Dollar strengthens across the board after US economic data.
- Gold accelerates bearish correction after a four-day positive streak.
- US yields break to the upside, Wall Street turns negative.
The pair currently trades last at 1832.53.
The previous day high was 1865.15 while the previous day low was 1836.25. The daily 38.2% Fib levels comes at 1854.11, expected to provide resistance. Similarly, the daily 61.8% fib level is at 1847.29, expected to provide resistance.
Gold Prices are falling by more than 1% on Thursday, retreating from the highest level since mid-June on the back of a stronger US Dollar and surging Treasury bond yields. XAU/USD printed a fresh two-day low at $1,831/oz.
Gold was already trading lower on Thursday when economic data from the US strengthened the US Dollar and triggered a sell-off in Treasury bonds. The ADP employment report showed an increase in private payrolls by 235K above the 150K of market consensus. Initial Jobless Claims dropped more than expected to 204K, the lowest since September.
Markets reacted to the economic figures, after holding quiet following the FOMC minutes on Wednesday. The DXY jumped to 104.96, the highest level in three weeks while US bonds tumbled. The US 10-year yield rose from 3.70% to 3.76% while the 2-year jumped from 4.39% to 4.48%, the highest level since late November.
The yellow metal broke decisively under $1,850 and tumbled to $1,831. It is hovering around $1,835 after Wall Street negative opening. The Dow Jones is falling by 0.75% and the Nasdaq drops by 0.79%.
XAU/USD looks vulnerable for the moment but losses seem limited while above the $1,830 area. The mentioned zone is a strong support that if broken should open the doors to another leg lower. On the upside, a recovery above $1,850 would change the intraday outlook to positive.
Technical Levels: Supports and Resistances
XAUUSD currently trading at 1836.17 at the time of writing. Pair opened at 1855.38 and is trading with a change of -1.04 % .
| Overview | Overview.1 | |
|---|---|---|
| 0 | Today last price | 1836.17 |
| 1 | Today Daily Change | -19.21 |
| 2 | Today Daily Change % | -1.04 |
| 3 | Today daily open | 1855.38 |
The pair remains strongly bullish on the daily timeframe. It trades above its 20 SMA @ 1806.47, 50 SMA 1760.84, 100 SMA @ 1725.02 and 200 SMA @ 1778.94.
| Trends | Trends.1 | |
|---|---|---|
| 0 | Daily SMA20 | 1806.47 |
| 1 | Daily SMA50 | 1760.84 |
| 2 | Daily SMA100 | 1725.02 |
| 3 | Daily SMA200 | 1778.94 |
The previous day high was 1865.15 while the previous day low was 1836.25. The daily 38.2% Fib levels comes at 1854.11, expected to provide resistance. Similarly, the daily 61.8% fib level is at 1847.29, expected to provide resistance.
Note the levels of interest below:
- Pivot support is noted at 1839.37, 1823.36, 1810.47
- Pivot resistance is noted at 1868.27, 1881.16, 1897.17
| Levels | Levels.1 |
|---|---|
| Previous Daily High | 1865.15 |
| Previous Daily Low | 1836.25 |
| Previous Weekly High | 1833.38 |
| Previous Weekly Low | 1797.11 |
| Previous Monthly High | 1833.38 |
| Previous Monthly Low | 1765.89 |
| Daily Fibonacci 38.2% | 1854.11 |
| Daily Fibonacci 61.8% | 1847.29 |
| Daily Pivot Point S1 | 1839.37 |
| Daily Pivot Point S2 | 1823.36 |
| Daily Pivot Point S3 | 1810.47 |
| Daily Pivot Point R1 | 1868.27 |
| Daily Pivot Point R2 | 1881.16 |
| Daily Pivot Point R3 | 1897.17 |
[/s2If]
Join Our Telegram Group


