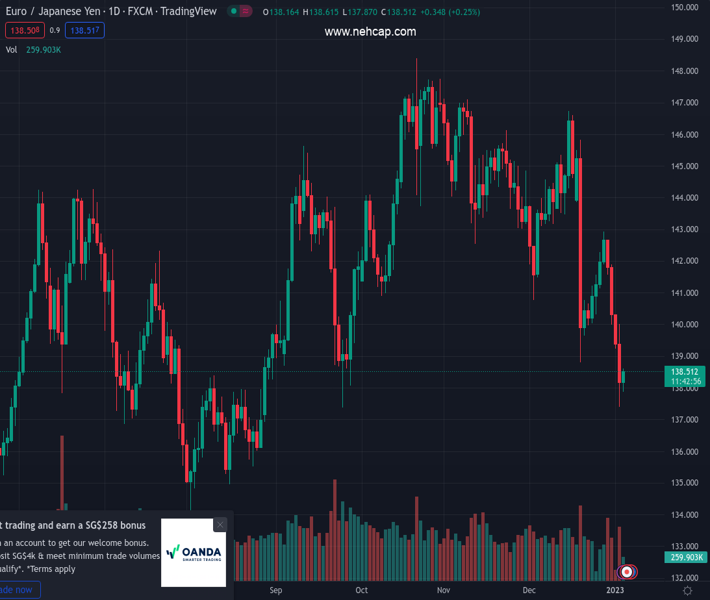
#EURJPY @ 138.490 picks up some upside traction and regains 138.00. (Pivot Orderbook analysis)
…
This is a premium post.
[s2If !current_user_can(access_s2member_level4)]Please register for PREMIUM VERSION HERE to read full post below containing analysis. In case of any error or you think you are not able to read the full post below, please email us at support#nehcap.com [lwa][/s2If] [s2If current_user_can(access_s2member_level4)]
- EUR/JPY picks up some upside traction and regains 138.00.
- The immediate target appears at the 200-day SMA (140.45).
The pair currently trades last at 138.490.
The previous day high was 140.02 while the previous day low was 137.39. The daily 38.2% Fib levels comes at 138.39, expected to provide support. Similarly, the daily 61.8% fib level is at 139.01, expected to provide resistance.
EUR/JPY manages to leave behind four consecutive daily drops and reclaims the area beyond 138.00 the figure on Wednesday.
Despite the daily bounce, the cross still trades under pressure and the door remains open to another probable visit to recent lows in the 137.40/35 band (January 3).
The outlook for EUR/JPY is expected to remain negative while below the 200-day SMA, today at 140.45.
Technical Levels: Supports and Resistances
EURJPY currently trading at 138.46 at the time of writing. Pair opened at 138.18 and is trading with a change of 0.2 % .
| Overview | Overview.1 | |
|---|---|---|
| 0 | Today last price | 138.46 |
| 1 | Today Daily Change | 74.00 |
| 2 | Today Daily Change % | 0.20 |
| 3 | Today daily open | 138.18 |
The pair remains strongly bearish on the daily time frame. It trades below the 20 SMA @ 142.46, 50 SMA 143.93, 100 SMA @ 142.83 and 200 SMA @ 140.48.
| Trends | Trends.1 | |
|---|---|---|
| 0 | Daily SMA20 | 142.46 |
| 1 | Daily SMA50 | 143.93 |
| 2 | Daily SMA100 | 142.83 |
| 3 | Daily SMA200 | 140.48 |
The previous day high was 140.02 while the previous day low was 137.39. The daily 38.2% Fib levels comes at 138.39, expected to provide support. Similarly, the daily 61.8% fib level is at 139.01, expected to provide resistance.
Note the levels of interest below:
- Pivot support is noted at 137.04, 135.9, 134.41
- Pivot resistance is noted at 139.67, 141.16, 142.31
| Levels | Levels.1 |
|---|---|
| Previous Daily High | 140.02 |
| Previous Daily Low | 137.39 |
| Previous Weekly High | 142.94 |
| Previous Weekly Low | 140.00 |
| Previous Monthly High | 146.73 |
| Previous Monthly Low | 138.80 |
| Daily Fibonacci 38.2% | 138.39 |
| Daily Fibonacci 61.8% | 139.01 |
| Daily Pivot Point S1 | 137.04 |
| Daily Pivot Point S2 | 135.90 |
| Daily Pivot Point S3 | 134.41 |
| Daily Pivot Point R1 | 139.67 |
| Daily Pivot Point R2 | 141.16 |
| Daily Pivot Point R3 | 142.31 |
[/s2If]
Join Our Telegram Group
")


