#EURUSD @ 1.05576 is displaying a sideways profile around 1.0550 ahead of FOMC minutes and US ISM PMI data. (Pivot Orderbook analysis)
…
This is a premium post.
[s2If !current_user_can(access_s2member_level4)]Please register for PREMIUM VERSION HERE to read full post below containing analysis. In case of any error or you think you are not able to read the full post below, please email us at support#nehcap.com [lwa][/s2If] [s2If current_user_can(access_s2member_level4)]
- EUR/USD is displaying a sideways profile around 1.0550 ahead of FOMC minutes and US ISM PMI data.
- Lower dependence on debt by corporate might impact the US Manufacturing PMI.
- A decline in energy prices and the government’s one-off payment of household energy bills have trimmed German HICP.
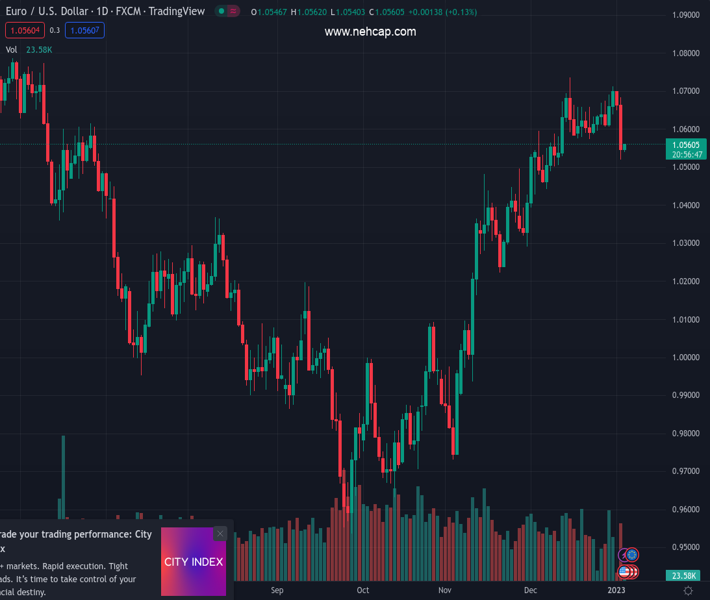
The pair currently trades last at 1.05576.
The previous day high was 1.0684 while the previous day low was 1.052. The daily 38.2% Fib levels comes at 1.0582, expected to provide resistance. Similarly, the daily 61.8% fib level is at 1.0621, expected to provide resistance.
The EUR/USD pair has sensed a tepid demand around the cushion of 1.0540 in the Asian session. The major currency pair is broadly displaying back-and-forth moves around 1.0550 as investors are awaiting the release of the United States ISM Manufacturing PMI data for fresh cues.
The major remained in a negative trajectory on Tuesday as investors underpinned the risk-aversion theme. S&P500 witnessed a sell-off from the market participants ahead of the Federal Open Market Committee (FOMC) minutes, which are scheduled for Thursday. The US Dollar Index (DXY) is displaying an inventory adjustment of around 104.40 and is aiming to extend its recovery ahead.
On Wednesday, investors will keep an eye on the release of the S ISM Manufacturing PMI, which is likely to decline to 48.5 vs. the former release of 49.0. Higher interest rates by the Federal Reserve (Fed) are resulting in lower dependence on debt by corporate as it will lead to higher interest obligations. Therefore, a drop in investment decisions and expansion in current capacity is impacting the volume of manufacturing activities. Also, a decline in retail demand has trimmed supply from factory gates.
Apart from the Manufacturing PMI, the catalyst that will impact the US Dollar is the New Orders Index, which is expected to improve to 48.1 vs. the former release of 47.2. The catalyst indicates the extent of forward demand, which might support a bullish extension in the current range of the USD Index.
On the Eurozone front, the German Harmonized Index of Consumer Prices (HICP) has dropped to 9.6% while the street was expecting a drop to 10.7% from the former release of 11.3%. According to Reuters, a significant drop in the price index is backed by falling energy prices and the government’s one-off payment of household energy bills. This is going to delight the European Central Bank (ECB), which is worried about rising inflation.
Technical Levels: Supports and Resistances
EURUSD currently trading at 1.0556 at the time of writing. Pair opened at 1.0552 and is trading with a change of 0.04 % .
| Overview | Overview.1 | |
|---|---|---|
| 0 | Today last price | 1.0556 |
| 1 | Today Daily Change | 0.0004 |
| 2 | Today Daily Change % | 0.0400 |
| 3 | Today daily open | 1.0552 |
The pair is trading below its 20 Daily moving average @ 1.0608, above its 50 Daily moving average @ 1.0375 , above its 100 Daily moving average @ 1.0135 and above its 200 Daily moving average @ 1.0321
| Trends | Trends.1 | |
|---|---|---|
| 0 | Daily SMA20 | 1.0608 |
| 1 | Daily SMA50 | 1.0375 |
| 2 | Daily SMA100 | 1.0135 |
| 3 | Daily SMA200 | 1.0321 |
The previous day high was 1.0684 while the previous day low was 1.052. The daily 38.2% Fib levels comes at 1.0582, expected to provide resistance. Similarly, the daily 61.8% fib level is at 1.0621, expected to provide resistance.
Note the levels of interest below:
- Pivot support is noted at 1.0486, 1.0421, 1.0322
- Pivot resistance is noted at 1.065, 1.0749, 1.0814
| Levels | Levels.1 |
|---|---|
| Previous Daily High | 1.0684 |
| Previous Daily Low | 1.0520 |
| Previous Weekly High | 1.0713 |
| Previous Weekly Low | 1.0607 |
| Previous Monthly High | 1.0736 |
| Previous Monthly Low | 1.0393 |
| Daily Fibonacci 38.2% | 1.0582 |
| Daily Fibonacci 61.8% | 1.0621 |
| Daily Pivot Point S1 | 1.0486 |
| Daily Pivot Point S2 | 1.0421 |
| Daily Pivot Point S3 | 1.0322 |
| Daily Pivot Point R1 | 1.0650 |
| Daily Pivot Point R2 | 1.0749 |
| Daily Pivot Point R3 | 1.0814 |
[/s2If]
Join Our Telegram Group
")


