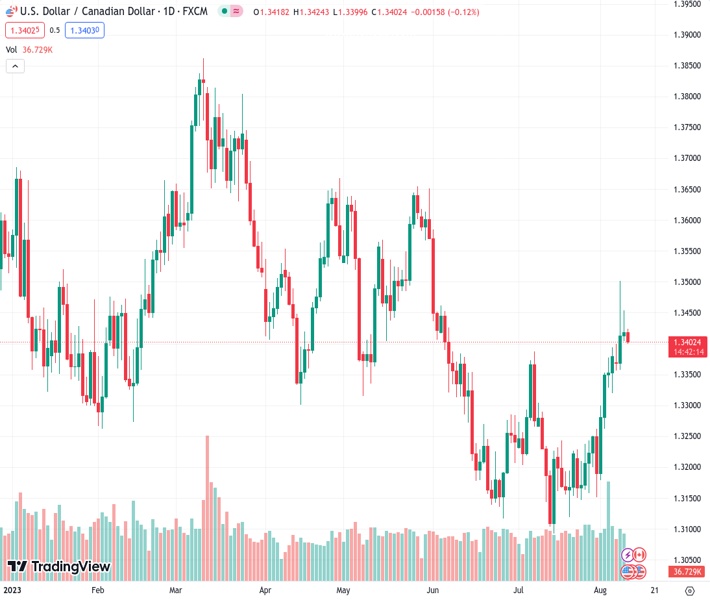
The USDCAD pair has declined to a new daily low of 1.34003, experiencing its most significant loss in over a week.
…
This is a premium post.
[s2If !current_user_can(access_s2member_level4)]Please register for FREE REGISTER to read full post below containing analysis. In case of any error or you think you are not able to read the full post below, please email us at support#nehcap.com [lwa][/s2If] [s2If current_user_can(access_s2member_level1)]
- USD/CAD takes offers to refresh intraday low, printing the biggest daily loss, so far, in more than a week.
The pair currently trades last at 1.34003.
The previous day high was 1.3454 while the previous day low was 1.3404. The daily 38.2% Fib levels comes at 1.3435, expected to provide resistance. Similarly, the daily 61.8% fib level is at 1.3423, expected to provide resistance.
USD/CAD justifies bearish technical signals while refreshing intraday low to around 1.3400 amid the early hours of Thursday morning in Europe. Apart from the technical details, mentioned below, the Loonie pair’s latest weakness could also be linked to the firmer price of Canada’s main export item WTI crude oil, as well as the US Dollar’s retreat.
US Dollar Index (DXY) remains depressed near 102.45 after snapping a two-day uptrend the previous day. In doing so, the Greenback’s gauge versus the six major currencies justifies the market’s cautious mood ahead of the US inflation data, namely the Consumer Price Index (CPI) for July. Additionally weighing on the DXY is the market’s cautious optimism.
It should be noted that the US-China trade war and looming Sino-UK tension fail to spoil the market’s mood as China policymakers show confidence in taming the economic fears.
That said, Financial Times (FT) came out with the news suggesting that UK Prime Minister Rishi Sunak is weighing whether to follow US President Joe Biden in restricting outbound investment into the Chinese tech sector, including artificial intelligence, chips and quantum computing. Before that, US President Joe Biden signed the much-awaited bill that allows the US Treasury Department to prohibit or restrict certain US investments in Chinese entities, per Reuters. In a reaction, China’s Commerce Ministry cited “grave concerns” and marked the right to take measures against the US ban on technology investment. However, such an issue was long discussed and the announced steps are slightly lenient than originally planned, which in turn allowed the markets to remain cautiously optimistic.
Elsewhere, the firmer sentiment and likely improvement in demand from China join the looming supply crunch from Saudi Arabia and Russia to propel the WTI crude oil. Additionally, a clear upside break of an eight-month-old horizontal resistance, now immediate support around $83.50, as well as the softer DXY also allowed WTI to remain firmer around the yearly top, up 0.40% intraday near $84.05 by the press time.
Amid these plays, S&P500 Futures print mild gains despite Wall Street’s downbeat closing whereas the US Treasury bond yields also pare weekly losses.
Looking ahead, the early signals for the US inflation data and the downbeat prints of the US Nonfarm Payrolls (NFP) underpin the dovish Fed bias, which in turn seeks confirmation from today’s US CPI.
Wednesday’s Doji candlestick below the convergence of a five-month-old descending trend line and the 200-DMA, around 1.3450, directs the USD/CAD pair towards 1.3390-85 support area including July’s peak and the 100-DMA.
Technical Levels: Supports and Resistances
USDCAD currently trading at 1.3407 at the time of writing. Pair opened at 1.3419 and is trading with a change of -0.09% % .
| Overview | Overview.1 | |
|---|---|---|
| 0 | Today last price | 1.3407 |
| 1 | Today Daily Change | -0.0012 |
| 2 | Today Daily Change % | -0.09% |
| 3 | Today daily open | 1.3419 |
The pair is trading above its 20 Daily moving average @ 1.3252, above its 50 Daily moving average @ 1.3268 , above its 100 Daily moving average @ 1.3393 and below its 200 Daily moving average @ 1.3452
| Trends | Trends.1 | |
|---|---|---|
| 0 | Daily SMA20 | 1.3252 |
| 1 | Daily SMA50 | 1.3268 |
| 2 | Daily SMA100 | 1.3393 |
| 3 | Daily SMA200 | 1.3452 |
The previous day high was 1.3454 while the previous day low was 1.3404. The daily 38.2% Fib levels comes at 1.3435, expected to provide resistance. Similarly, the daily 61.8% fib level is at 1.3423, expected to provide resistance.
Note the levels of interest below:
- Pivot support is noted at 1.3397, 1.3376, 1.3347
- Pivot resistance is noted at 1.3447, 1.3476, 1.3497
| Levels | Levels.1 |
|---|---|
| Previous Daily High | 1.3454 |
| Previous Daily Low | 1.3404 |
| Previous Weekly High | 1.3394 |
| Previous Weekly Low | 1.3151 |
| Previous Monthly High | 1.3387 |
| Previous Monthly Low | 1.3093 |
| Daily Fibonacci 38.2% | 1.3435 |
| Daily Fibonacci 61.8% | 1.3423 |
| Daily Pivot Point S1 | 1.3397 |
| Daily Pivot Point S2 | 1.3376 |
| Daily Pivot Point S3 | 1.3347 |
| Daily Pivot Point R1 | 1.3447 |
| Daily Pivot Point R2 | 1.3476 |
| Daily Pivot Point R3 | 1.3497 |
[/s2If]
Download Nehcap EAWe have two EAs that are operational on our LIVE accounts.
- EA-FIX: Check out the details here. Download EA-FIX . EA-FIX is a non-grid HFT scalper.
- EA-GROWTH: High quality low dd EA using trend grids. Download EA_GROWTHJoin Our Telegram Group
")


