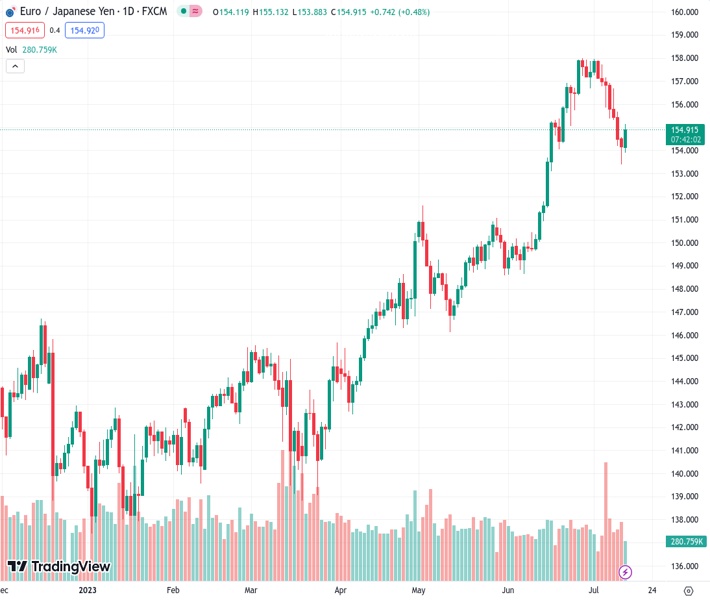
Thursday sees an increase in upward movement for #EURJPY, with a value of 154.879.
…
This is a premium post.
[s2If !current_user_can(access_s2member_level4)]Please register for FREE REGISTER to read full post below containing analysis. In case of any error or you think you are not able to read the full post below, please email us at support#nehcap.com [lwa][/s2If] [s2If current_user_can(access_s2member_level1)]
- EUR/JPY manages to gather some upside traction on Thursday.
The pair currently trades last at 154.879.
The previous day high was 154.55 while the previous day low was 153.43. The daily 38.2% Fib levels comes at 153.86, expected to provide support. Similarly, the daily 61.8% fib level is at 154.12, expected to provide support.
EUR/JPY partially reverses the recent 7-session negative streak on Thursday.
The cross regains some balance and manages to bounce off Wednesday’s 4-week lows near 153.30. In case sellers return to the market, the cross risks a probable decline to the intermediary 55-day SMA, today at 151.91.
So far, the longer term positive outlook for the cross appears favoured while above the 200-day SMA, today at 145.81.
Technical Levels: Supports and Resistances
EURJPY currently trading at 154.73 at the time of writing. Pair opened at 154.12 and is trading with a change of 0.4 % .
| Overview | Overview.1 | |
|---|---|---|
| 0 | Today last price | 154.73 |
| 1 | Today Daily Change | 112.00 |
| 2 | Today Daily Change % | 0.40 |
| 3 | Today daily open | 154.12 |
The pair is trading below its 20 Daily moving average @ 156.18, above its 50 Daily moving average @ 152.05 , above its 100 Daily moving average @ 148.48 and above its 200 Daily moving average @ 145.78
| Trends | Trends.1 | |
|---|---|---|
| 0 | Daily SMA20 | 156.18 |
| 1 | Daily SMA50 | 152.05 |
| 2 | Daily SMA100 | 148.48 |
| 3 | Daily SMA200 | 145.78 |
The previous day high was 154.55 while the previous day low was 153.43. The daily 38.2% Fib levels comes at 153.86, expected to provide support. Similarly, the daily 61.8% fib level is at 154.12, expected to provide support.
Note the levels of interest below:
- Pivot support is noted at 153.51, 152.91, 152.4
- Pivot resistance is noted at 154.63, 155.15, 155.75
| Levels | Levels.1 |
|---|---|
| Previous Daily High | 154.55 |
| Previous Daily Low | 153.43 |
| Previous Weekly High | 157.96 |
| Previous Weekly Low | 155.38 |
| Previous Monthly High | 158.00 |
| Previous Monthly Low | 148.62 |
| Daily Fibonacci 38.2% | 153.86 |
| Daily Fibonacci 61.8% | 154.12 |
| Daily Pivot Point S1 | 153.51 |
| Daily Pivot Point S2 | 152.91 |
| Daily Pivot Point S3 | 152.40 |
| Daily Pivot Point R1 | 154.63 |
| Daily Pivot Point R2 | 155.15 |
| Daily Pivot Point R3 | 155.75 |
[/s2If]
Download Nehcap EAWe have two EAs that are operational on our LIVE accounts.
- EA-FIX: Check out the details here. Download EA-FIX . EA-FIX is a non-grid HFT scalper.
- EA-GROWTH: High quality low dd EA using trend grids. Download EA_GROWTHJoin Our Telegram Group
")


