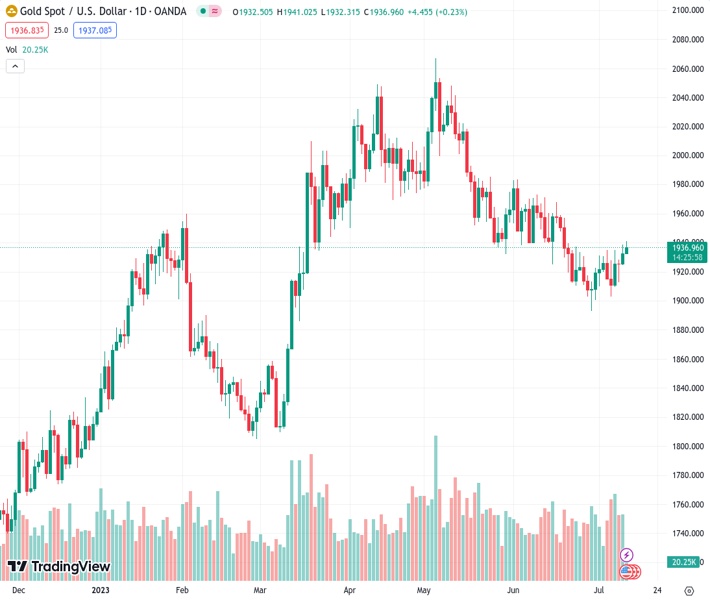
Gold’s price has reached a new high for the past three weeks, surpassing the $1,940.00 mark, in anticipation of US inflation data and the release of the Federal Reserve’s Beige Book report.
…
This is a premium post.
[s2If !current_user_can(access_s2member_level4)]Please register for FREE REGISTER to read full post below containing analysis. In case of any error or you think you are not able to read the full post below, please email us at support#nehcap.com [lwa][/s2If] [s2If current_user_can(access_s2member_level1)]
- Gold price has printed a fresh three-week high above $1,940.00 ahead of US inflation and Fed’s Beige Book.
The pair currently trades last at 1937.31.
The previous day high was 1938.54 while the previous day low was 1924.44. The daily 38.2% Fib levels comes at 1933.15, expected to provide support. Similarly, the daily 61.8% fib level is at 1929.83, expected to provide support.
Gold price (XAU/USD) has printed a fresh three-week high at $1,941.60 in the early European session. The precious metal is gathering strength to deliver a confident break above $1,940.00 as the US Dollar Index (DXY) is under extreme pressure due to expectations of further deceleration in the United States Consumer Price Index (CPI) data.
S&P500 futures have turned choppy after a bullish Tuesday, portraying quiet market sentiment for now in the overall upbeat risk profile. Investors have sidelined ahead of the second-quarter corporate earnings and inflation data. The 10-year US Treasury yields have shown a minor decline to near 3.96%.
The USD Index has found intermediate support near 101.35, however, the downside bias is still solid. Economists at Commerzbank cited it would probably be too early though to write off the Dollar at this stage. The labor market report on Friday was not that bad after all. We assume that the labor market remains too tight for the liking of the Federal Reserve (Fed) and that it will therefore hike its key rate once again at the end of July.
Meanwhile, investors are entirely focusing on the inflation data. As per expectations, monthly and core inflation are expected to maintain a steady pace of 0.3%. Annualized figures for headline and core CPI are likely to soften to 3.1% and 5.0% respectively. Apart from the inflation data, investors will also focus on the Fed’s Beige Book.
Gold price is on the verge of delivering a breakout of the Inverted Head and Shoulder chart pattern formed on a two-hour scale. A breakout of the aforementioned chart pattern will result in a bullish reversal. The neckline of the chart pattern is plotted around June 21 high at $1,940.00.
The 50-period Exponential Moving Average (EMA) at $1,927.65 is providing a cushion to the Gold bulls.
Meanwhile, the Relative Strength Index (RSI) (14) has confidently shifted into the bullish range of 60.00-80.00, which indicates that the bullish momentum has been triggered.
Technical Levels: Supports and Resistances
XAUUSD currently trading at 1938.89 at the time of writing. Pair opened at 1932.26 and is trading with a change of 0.34 % .
| Overview | Overview.1 | |
|---|---|---|
| 0 | Today last price | 1938.89 |
| 1 | Today Daily Change | 6.63 |
| 2 | Today Daily Change % | 0.34 |
| 3 | Today daily open | 1932.26 |
The pair is trading above its 20 Daily moving average @ 1927.0, below its 50 Daily moving average @ 1959.16 , below its 100 Daily moving average @ 1949.73 and above its 200 Daily moving average @ 1868.82
| Trends | Trends.1 | |
|---|---|---|
| 0 | Daily SMA20 | 1927.00 |
| 1 | Daily SMA50 | 1959.16 |
| 2 | Daily SMA100 | 1949.73 |
| 3 | Daily SMA200 | 1868.82 |
The previous day high was 1938.54 while the previous day low was 1924.44. The daily 38.2% Fib levels comes at 1933.15, expected to provide support. Similarly, the daily 61.8% fib level is at 1929.83, expected to provide support.
Note the levels of interest below:
- Pivot support is noted at 1924.95, 1917.65, 1910.85
- Pivot resistance is noted at 1939.05, 1945.85, 1953.15
| Levels | Levels.1 |
|---|---|
| Previous Daily High | 1938.54 |
| Previous Daily Low | 1924.44 |
| Previous Weekly High | 1935.09 |
| Previous Weekly Low | 1902.77 |
| Previous Monthly High | 1983.50 |
| Previous Monthly Low | 1893.01 |
| Daily Fibonacci 38.2% | 1933.15 |
| Daily Fibonacci 61.8% | 1929.83 |
| Daily Pivot Point S1 | 1924.95 |
| Daily Pivot Point S2 | 1917.65 |
| Daily Pivot Point S3 | 1910.85 |
| Daily Pivot Point R1 | 1939.05 |
| Daily Pivot Point R2 | 1945.85 |
| Daily Pivot Point R3 | 1953.15 |
[/s2If]
Download Nehcap EAWe have two EAs that are operational on our LIVE accounts.
- EA-FIX: Check out the details here. Download EA-FIX . EA-FIX is a non-grid HFT scalper.
- EA-GROWTH: High quality low dd EA using trend grids. Download EA_GROWTHJoin Our Telegram Group
")


