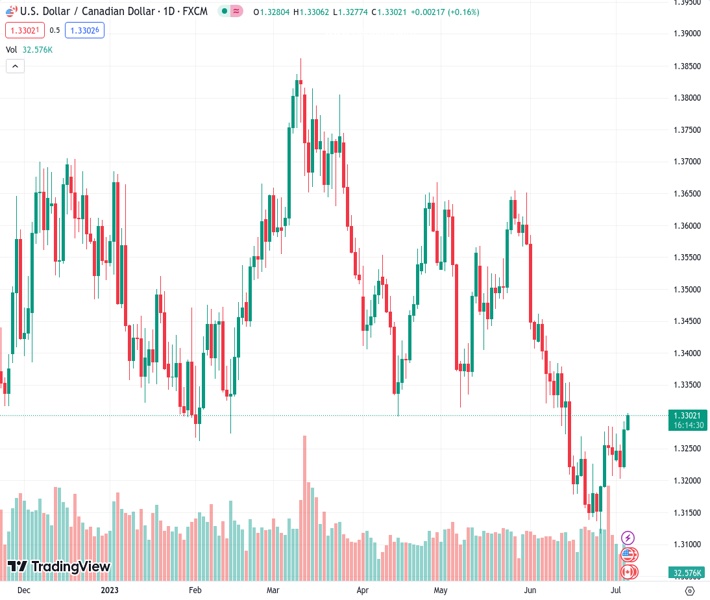
The US Dollar to Canadian Dollar exchange rate, which currently stands at 1.33022, supports the breakout of the 21-day exponential moving average (EMA) to reach its highest point in three weeks. However, referring to Nehcap’s perspective, it is expected that there will be a limited increase in its value from this point.
…
This is a premium post.
[s2If !current_user_can(access_s2member_level4)]Please register for FREE REGISTER to read full post below containing analysis. In case of any error or you think you are not able to read the full post below, please email us at support#nehcap.com [lwa][/s2If] [s2If current_user_can(access_s2member_level1)]
- USD/CAD justifies 21-EMA breakout to refresh three-week high.
The pair currently trades last at 1.33022.
The previous day high was 1.3293 while the previous day low was 1.322. The daily 38.2% Fib levels comes at 1.3265, expected to provide support. Similarly, the daily 61.8% fib level is at 1.3248, expected to provide support.
USD/CAD picks up bids to refresh the highest levels in three weeks around 1.3305 heading into Thursday’s European session.
In doing so, the Loonie pair takes clues from the market’s broad risk aversion which propels the US Dollar while weighing on the prices of commodities and antipodeans. It’s worth noting that the grim concerns about China, one of the world’s biggest commodity users exert additional downside pressure on the Oil Price, which in turn propels the major currency pair due to Canada’s reliance on energy export as the key earning source.
Also read: Asian stocks drop as S&P500 Futures slide to 4,470, US Treasury bond yields refresh three-month high
Technically, a clear upside break of the 21-Exponential Moving Average (EMA), around 1.3275 by the press time, joins the bullish MACD signals and upbeat RSI (14) line, not overbought, to propel the Loonie pair.
That said, lows marked during April and May near 1.3300 and 1.3315 restrict immediate upside of the USD/CAD pair ahead of the key 1.3360 resistance confluence comprising the 50-EMA and previous support line stretched from February.
On the flip side, pullback in the USD/CAD price remains elusive unless staying beyond the one-week-old rising support line, near 1.3245 at the latest.
Following that, the 1.3200 round figure and the latest multi-month low marked the last week around 1.3115 can’t be ruled out.
Trend: Limited upside expected
Technical Levels: Supports and Resistances
USDCAD currently trading at 1.3302 at the time of writing. Pair opened at 1.3281 and is trading with a change of 0.16% % .
| Overview | Overview.1 | |
|---|---|---|
| 0 | Today last price | 1.3302 |
| 1 | Today Daily Change | 0.0021 |
| 2 | Today Daily Change % | 0.16% |
| 3 | Today daily open | 1.3281 |
The pair is trading above its 20 Daily moving average @ 1.3247, below its 50 Daily moving average @ 1.3402 , below its 100 Daily moving average @ 1.3491 and below its 200 Daily moving average @ 1.3507
| Trends | Trends.1 | |
|---|---|---|
| 0 | Daily SMA20 | 1.3247 |
| 1 | Daily SMA50 | 1.3402 |
| 2 | Daily SMA100 | 1.3491 |
| 3 | Daily SMA200 | 1.3507 |
The previous day high was 1.3293 while the previous day low was 1.322. The daily 38.2% Fib levels comes at 1.3265, expected to provide support. Similarly, the daily 61.8% fib level is at 1.3248, expected to provide support.
Note the levels of interest below:
- Pivot support is noted at 1.3236, 1.3192, 1.3163
- Pivot resistance is noted at 1.3309, 1.3338, 1.3382
| Levels | Levels.1 |
|---|---|
| Previous Daily High | 1.3293 |
| Previous Daily Low | 1.3220 |
| Previous Weekly High | 1.3285 |
| Previous Weekly Low | 1.3117 |
| Previous Monthly High | 1.3585 |
| Previous Monthly Low | 1.3117 |
| Daily Fibonacci 38.2% | 1.3265 |
| Daily Fibonacci 61.8% | 1.3248 |
| Daily Pivot Point S1 | 1.3236 |
| Daily Pivot Point S2 | 1.3192 |
| Daily Pivot Point S3 | 1.3163 |
| Daily Pivot Point R1 | 1.3309 |
| Daily Pivot Point R2 | 1.3338 |
| Daily Pivot Point R3 | 1.3382 |
[/s2If]
Nehcap Expert Advisor
The NEHCAP MT4 EA is high quality professional trading system geared to generate returns without using GRID or martingales. Each trade has strict risk per trade parameter. The pairs under management include EURUSD, GBPUSD, AUDCAD, AUDNZD,GBPAUD, EURAUD, EURCAD, CHFJPY and many more.
The system is trading live: LIVE ACCOUNT TRACKING
You can run it free. Apply for a free trial and track our account. Buy the system or use profit share mechanism to generate returns on your MT4.
Join Our Telegram Group
")


