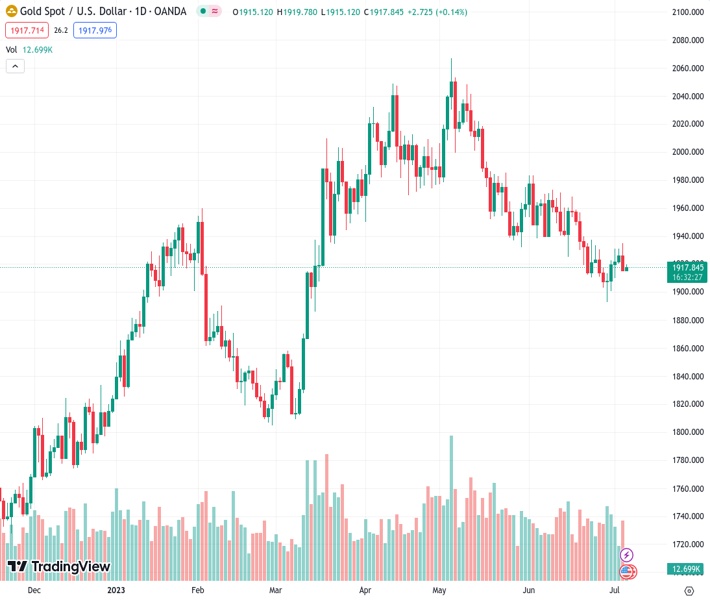
The price of gold, denoted as XAUUSD, rose to 1,917.79 on Thursday, as it showed some upward movement and managed to recover a portion of the losses it incurred overnight.
…
This is a premium post.
[s2If !current_user_can(access_s2member_level4)]Please register for FREE REGISTER to read full post below containing analysis. In case of any error or you think you are not able to read the full post below, please email us at support#nehcap.com [lwa][/s2If] [s2If current_user_can(access_s2member_level1)]
- Gold price regains some positive traction on Thursday and recovers a part of the overnight losses.
The pair currently trades last at 1917.79.
The previous day high was 1935.09 while the previous day low was 1914.84. The daily 38.2% Fib levels comes at 1922.58, expected to provide resistance. Similarly, the daily 61.8% fib level is at 1927.35, expected to provide resistance.
Gold price attracts some dip-buying during the Asian session on Thursday and reverses a part of the previous day’s retracement slide from the $1,935 region, or a nearly two-week high. The XAU/USD currently trades just below the $1,920 level, up 0.20% for the day, though any meaningful appreciating move still seems elusive.
A private survey showed on Wednesday that business activity in China’s service sector grew less than expected in June and further fueled worries about a global economic downturn. Apart from this, the potential risk of a further escalation in a trade conflict between China and the US – the world’s largest economies – tempers investors’ appetite for perceived riskier assets. This is evident from a generally weaker tone around the equity markets and turning out to be a key factor lending some support to the safe-haven Gold price. That said, the prospects for further policy tightening by the Federal Reserve (Fed) might hold back traders from placing aggressive bullish bets around the non-yielding yellow metal.
The minutes from the June Federal Open Market Committee (FOMC) policy meeting released on Wednesday revealed that almost all members supported resuming rate hikes as inflation remains unacceptably high. Furthermore, some members were in Favor of raising rates rather than pausing at the June meeting, flagging a very tight labor market that threatens to push wages and inflation higher. The outlook reaffirms market bets for a 25 basis points (bps) lift-off at the upcoming FOMC meeting on July 25-26 and led to the overnight sharp rise in the US Treasury bond yields. This, along with a more hawkish stance adopted by other major central banks, might contribute to capping gains for the Gold price.
The current market pricing indicates the possibility of a further 130 bps of tightening by the Bank of England (BoE) by the end of this year. Moreover, BoE Governor Andrew Bailey last week justified the decision to hike interest rates by a jumbo 50 bps on June 22 and said that rates could remain at peak levels for longer than traders currently expect. Moreover, the European Central Bank (ECB) policymakers expect to increase borrowing costs again in July and September meetings despite signs the Euro Zone economy is flagging. This makes it prudent to wait for strong follow-through buying before positioning for the resumption of the recent recovery in the Gold price from its lowest level since mid-March.
From a technical perspective, the $1,925-$1,926 region is likely to act as an immediate hurdle ahead of the overnight swing high, around the $1,935 area. This is followed by the 100-day Simple Moving Average (SMA), currently around the $1,947 zone. A sustained strength beyond the latter might trigger a short-covering rally and lift the Gold price to the $1,962-$1,964 area en route to the $1,970-$1,972 supply zone. Some follow-through buying should allow bulls to reclaim the $2,000 psychological mark and test the $2,010-$2,012 resistance.
On the flip side, the $1,915-$1,914 region now seems to protect the immediate downside ahead of the $1,908-$1,907 area and the $1,900 mark. The next relevant support is pegged near the $1,893-$1,892 region or the multi-month low touched last week. A convincing break below the said support levels will make the Gold price vulnerable to accelerate the downward trajectory towards the very important 200-day Simple Moving Average (SMA), currently around the $1,860 zone.
Technical Levels: Supports and Resistances
XAUUSD currently trading at 1918.78 at the time of writing. Pair opened at 1915.41 and is trading with a change of 0.18 % .
| Overview | Overview.1 | |
|---|---|---|
| 0 | Today last price | 1918.78 |
| 1 | Today Daily Change | 3.37 |
| 2 | Today Daily Change % | 0.18 |
| 3 | Today daily open | 1915.41 |
The pair is trading below its 20 Daily moving average @ 1933.75, below its 50 Daily moving average @ 1964.83 , below its 100 Daily moving average @ 1946.38 and above its 200 Daily moving average @ 1863.76
| Trends | Trends.1 | |
|---|---|---|
| 0 | Daily SMA20 | 1933.75 |
| 1 | Daily SMA50 | 1964.83 |
| 2 | Daily SMA100 | 1946.38 |
| 3 | Daily SMA200 | 1863.76 |
The previous day high was 1935.09 while the previous day low was 1914.84. The daily 38.2% Fib levels comes at 1922.58, expected to provide resistance. Similarly, the daily 61.8% fib level is at 1927.35, expected to provide resistance.
Note the levels of interest below:
- Pivot support is noted at 1908.47, 1901.53, 1888.22
- Pivot resistance is noted at 1928.72, 1942.03, 1948.97
| Levels | Levels.1 |
|---|---|
| Previous Daily High | 1935.09 |
| Previous Daily Low | 1914.84 |
| Previous Weekly High | 1933.39 |
| Previous Weekly Low | 1893.01 |
| Previous Monthly High | 1983.50 |
| Previous Monthly Low | 1893.01 |
| Daily Fibonacci 38.2% | 1922.58 |
| Daily Fibonacci 61.8% | 1927.35 |
| Daily Pivot Point S1 | 1908.47 |
| Daily Pivot Point S2 | 1901.53 |
| Daily Pivot Point S3 | 1888.22 |
| Daily Pivot Point R1 | 1928.72 |
| Daily Pivot Point R2 | 1942.03 |
| Daily Pivot Point R3 | 1948.97 |
[/s2If]
Nehcap Expert Advisor
The NEHCAP MT4 EA is high quality professional trading system geared to generate returns without using GRID or martingales. Each trade has strict risk per trade parameter. The pairs under management include EURUSD, GBPUSD, AUDCAD, AUDNZD,GBPAUD, EURAUD, EURCAD, CHFJPY and many more.
The system is trading live: LIVE ACCOUNT TRACKING
You can run it free. Apply for a free trial and track our account. Buy the system or use profit share mechanism to generate returns on your MT4.
Join Our Telegram Group
")


