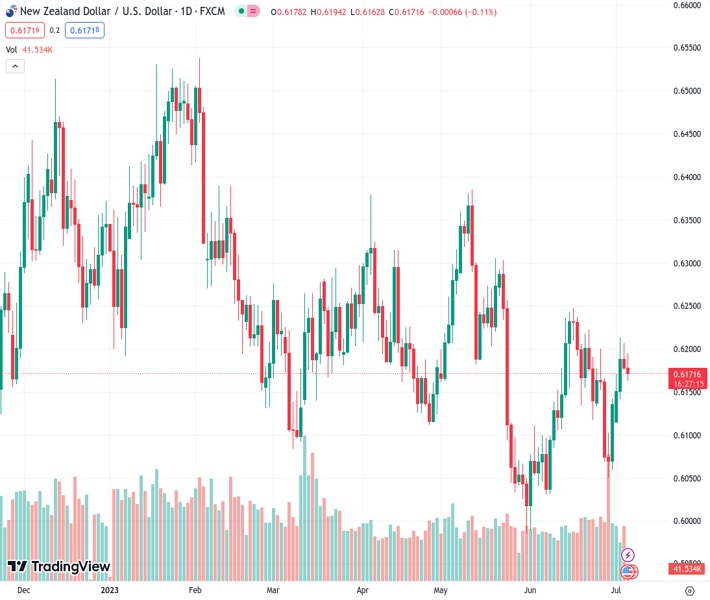
The NZDUSD pair, currently trading at 0.61729, is facing difficulty in continuing its reversal from a two-week high reached the previous day. It is fluctuating near the day’s low. @nehcap predicts a corrective rebound.
…
This is a premium post.
[s2If !current_user_can(access_s2member_level4)]Please register for FREE REGISTER to read full post below containing analysis. In case of any error or you think you are not able to read the full post below, please email us at support#nehcap.com [lwa][/s2If] [s2If current_user_can(access_s2member_level1)]
- NZD/USD struggles to extend the previous day’s U-turn from a fortnight high, seesaws near intraday low of late.
The pair currently trades last at 0.61729.
The previous day high was 0.6208 while the previous day low was 0.6175. The daily 38.2% Fib levels comes at 0.6188, expected to provide resistance. Similarly, the daily 61.8% fib level is at 0.6195, expected to provide resistance.
NZD/USD remains directionless at the intraday low surrounding 0.6170 during the mid-Asian session on Thursday. In doing so, the Kiwi pair struggles to extend the previous day’s losses, the first in four, while also reversing the pullback from the highest levels in two weeks.
The kiwi pair’s previous losses could be linked to a downside break of the one-week-old rising trend line, now immediate resistance around 0.6200, as well as bearish MACD signals. Adding strength to the downside bias could be the RSI (14) line’s U-turn from the overbought territory.
However, the resistance-turned-support stretched from early May, near 0.6165 by the press time, restricts the immediate downside of the NZD/USD pair.
Following that, a convergence of the 50-bar and 200-bar Exponential Moving Averages (EMAs), around 0.6150 at the latest, will be a tough nut to crack for the Kiwi bears.
Meanwhile, a corrective bounce past the immediate weekly resistance line, previous support near 0.6200, can propel the NZD/USD buyers to challenge the weekly high of around 0.6215.
Even so, the 61.8% Fibonacci retracement of the pair’s May month downside and the previous monthly peak, respectively near 0.6235 and 0.6250, could challenge the NZD/USD bulls before giving them control.
Trend: Corrective bounce expected
Technical Levels: Supports and Resistances
NZDUSD currently trading at 0.6174 at the time of writing. Pair opened at 0.6179 and is trading with a change of -0.08% % .
| Overview | Overview.1 | |
|---|---|---|
| 0 | Today last price | 0.6174 |
| 1 | Today Daily Change | -0.0005 |
| 2 | Today Daily Change % | -0.08% |
| 3 | Today daily open | 0.6179 |
The pair is trading above its 20 Daily moving average @ 0.6157, above its 50 Daily moving average @ 0.6169 , below its 100 Daily moving average @ 0.619 and above its 200 Daily moving average @ 0.6169
| Trends | Trends.1 | |
|---|---|---|
| 0 | Daily SMA20 | 0.6157 |
| 1 | Daily SMA50 | 0.6169 |
| 2 | Daily SMA100 | 0.6190 |
| 3 | Daily SMA200 | 0.6169 |
The previous day high was 0.6208 while the previous day low was 0.6175. The daily 38.2% Fib levels comes at 0.6188, expected to provide resistance. Similarly, the daily 61.8% fib level is at 0.6195, expected to provide resistance.
Note the levels of interest below:
- Pivot support is noted at 0.6167, 0.6154, 0.6134
- Pivot resistance is noted at 0.62, 0.622, 0.6233
| Levels | Levels.1 |
|---|---|
| Previous Daily High | 0.6208 |
| Previous Daily Low | 0.6175 |
| Previous Weekly High | 0.6202 |
| Previous Weekly Low | 0.6050 |
| Previous Monthly High | 0.6250 |
| Previous Monthly Low | 0.5990 |
| Daily Fibonacci 38.2% | 0.6188 |
| Daily Fibonacci 61.8% | 0.6195 |
| Daily Pivot Point S1 | 0.6167 |
| Daily Pivot Point S2 | 0.6154 |
| Daily Pivot Point S3 | 0.6134 |
| Daily Pivot Point R1 | 0.6200 |
| Daily Pivot Point R2 | 0.6220 |
| Daily Pivot Point R3 | 0.6233 |
[/s2If]
Nehcap Expert Advisor
The NEHCAP MT4 EA is high quality professional trading system geared to generate returns without using GRID or martingales. Each trade has strict risk per trade parameter. The pairs under management include EURUSD, GBPUSD, AUDCAD, AUDNZD,GBPAUD, EURAUD, EURCAD, CHFJPY and many more.
The system is trading live: LIVE ACCOUNT TRACKING
You can run it free. Apply for a free trial and track our account. Buy the system or use profit share mechanism to generate returns on your MT4.
Join Our Telegram Group
")


