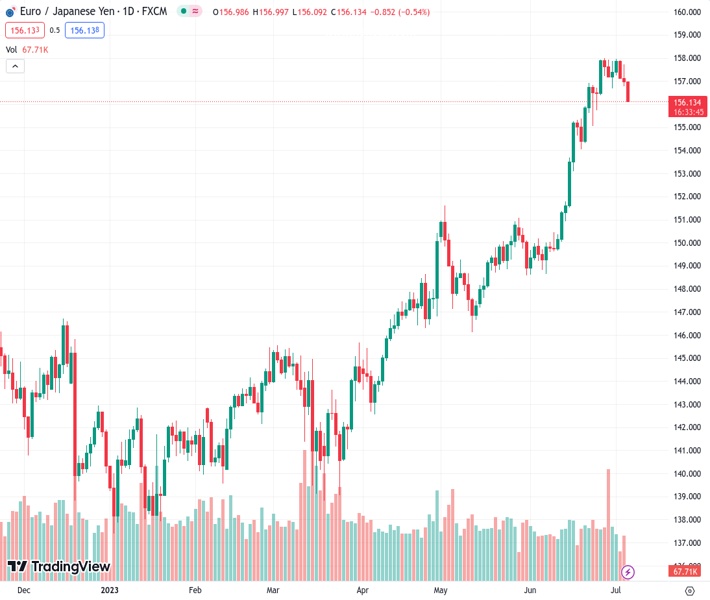
The EURJPY pair is steadily declining for the third day in a row and reaches its lowest point in almost two weeks on Friday.
…
This is a premium post.
[s2If !current_user_can(access_s2member_level4)]Please register for FREE REGISTER to read full post below containing analysis. In case of any error or you think you are not able to read the full post below, please email us at support#nehcap.com [lwa][/s2If] [s2If current_user_can(access_s2member_level1)]
- EUR/JPY drifts lower for the third successive day and drops to a nearly two-week low on Friday.
The pair currently trades last at 156.115.
The previous day high was 157.72 while the previous day low was 156.79. The daily 38.2% Fib levels comes at 157.14, expected to provide resistance. Similarly, the daily 61.8% fib level is at 157.37, expected to provide resistance.
The EUR/JPY cross remains under some selling pressure for the third successive day on Thursday and drops to a one-and-half-week low, around the 156.35-156.30 region during the Asian session.
The potential risk of intervention by Japanese authorities, along with a weaker tone around the equity markets, revives demand for the safe-haven Japanese Yen (JPY). The shared currency, on the other hand, is undermined by less hawkish remarks by the European Central Bank (ECB) Governing Council member Ignazio Visco on Wednesday, backing the case for a pause in the rate-hiking cycle. Addressing the annual general meeting of the Italian Banking Association (ABI), Visco said rates had reached restrictive territory and that the ECB could bring inflation back in line with its price stability goal by holding rates for a certain period of time rather than hiking them more.
Market participants, however, seem convinced that the ECB will increase borrowing costs again in July and September meetings despite signs the Euro Zone economy is flagging. In fact, ECB President Christine Lagarde said last week that inflation in the Euro Zone is too high and is set to remain so for too long. This, in turn, cemented market expectations for a ninth consecutive lift-off in July and also lifted bets for more rate hikes from the ECB this year. Even the International Monetary Fund (IMF) said on Friday that the ECB should continue to raise rates to bring down inflation. In contrast, the Bank of Japan (BoJ) is expected to stick to its dovish stance, which should limit losses for the EUR/JPY cross.
Market participants seem convinced that BoJ’s negative interest-rate policy will remain in place at least until next year. Moreover, BoJ Governor Kazuo Ueda, despite the fact that inflation in Japan has exceeded the 2% goal for more than a year, ruled out the possibility of any change in ultra-loose policy settings and signalled no immediate plans to alter the yield curve control measures. This makes it prudent to wait for strong follow-through selling before placing fresh bearish bets around the EUR/JPY cross and positioning for an extension of the recent pullback from the 158.00 mark, or its highest level since September 2008 touched last Wednesday.
Technical Levels: Supports and Resistances
EURJPY currently trading at 156.34 at the time of writing. Pair opened at 157.01 and is trading with a change of -0.43 % .
| Overview | Overview.1 | |
|---|---|---|
| 0 | Today last price | 156.34 |
| 1 | Today Daily Change | -0.67 |
| 2 | Today Daily Change % | -0.43 |
| 3 | Today daily open | 157.01 |
The pair remains strongly bullish on the daily timeframe. It trades above its 20 SMA @ 154.97, 50 SMA 151.47, 100 SMA @ 147.87 and 200 SMA @ 145.46.
| Trends | Trends.1 | |
|---|---|---|
| 0 | Daily SMA20 | 154.97 |
| 1 | Daily SMA50 | 151.47 |
| 2 | Daily SMA100 | 147.87 |
| 3 | Daily SMA200 | 145.46 |
The previous day high was 157.72 while the previous day low was 156.79. The daily 38.2% Fib levels comes at 157.14, expected to provide resistance. Similarly, the daily 61.8% fib level is at 157.37, expected to provide resistance.
Note the levels of interest below:
- Pivot support is noted at 156.63, 156.24, 155.69
- Pivot resistance is noted at 157.56, 158.11, 158.5
| Levels | Levels.1 |
|---|---|
| Previous Daily High | 157.72 |
| Previous Daily Low | 156.79 |
| Previous Weekly High | 158.00 |
| Previous Weekly Low | 155.75 |
| Previous Monthly High | 158.00 |
| Previous Monthly Low | 148.62 |
| Daily Fibonacci 38.2% | 157.14 |
| Daily Fibonacci 61.8% | 157.37 |
| Daily Pivot Point S1 | 156.63 |
| Daily Pivot Point S2 | 156.24 |
| Daily Pivot Point S3 | 155.69 |
| Daily Pivot Point R1 | 157.56 |
| Daily Pivot Point R2 | 158.11 |
| Daily Pivot Point R3 | 158.50 |
[/s2If]
Nehcap Expert Advisor
The NEHCAP MT4 EA is high quality professional trading system geared to generate returns without using GRID or martingales. Each trade has strict risk per trade parameter. The pairs under management include EURUSD, GBPUSD, AUDCAD, AUDNZD,GBPAUD, EURAUD, EURCAD, CHFJPY and many more.
The system is trading live: LIVE ACCOUNT TRACKING
You can run it free. Apply for a free trial and track our account. Buy the system or use profit share mechanism to generate returns on your MT4.
Join Our Telegram Group
")


