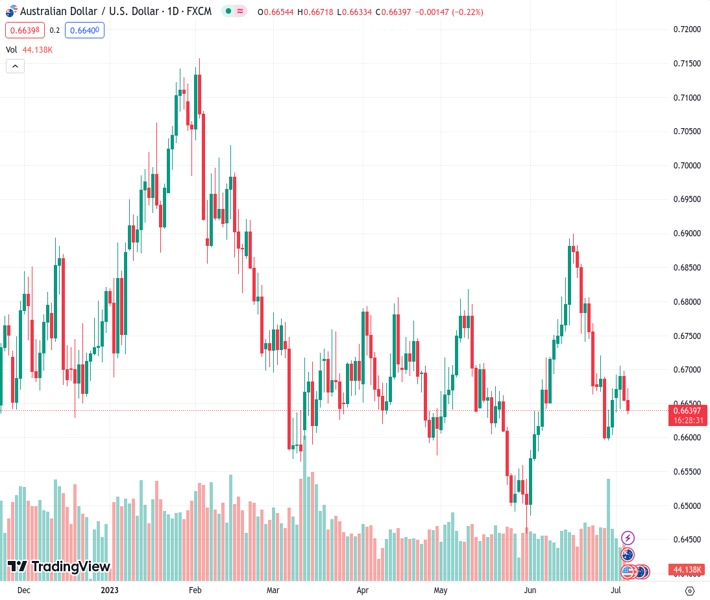
The AUDUSD currency pair, currently trading at a rate of 0.66396, has rebounded from its lowest point of the day and has made slight gains, although it is struggling to surpass the 50-day simple moving average obstacle. The perspective of Nehcap suggests a bearish outlook.
…
This is a premium post.
[s2If !current_user_can(access_s2member_level4)]Please register for FREE REGISTER to read full post below containing analysis. In case of any error or you think you are not able to read the full post below, please email us at support#nehcap.com [lwa][/s2If] [s2If current_user_can(access_s2member_level1)]
- AUD/USD bounces off intraday low to print mild gains, pokes 50-SMA hurdle.
The pair currently trades last at 0.66396.
The previous day high was 0.6698 while the previous day low was 0.6653. The daily 38.2% Fib levels comes at 0.667, expected to provide resistance. Similarly, the daily 61.8% fib level is at 0.6681, expected to provide resistance.
AUD/USD portrays a corrective bounce from the intraday low while picking up bids to 0.6665 after Australia trade numbers for May offer a positive surprise on early Thursday. In doing so, the Aussie pair prods the 50-SMA hurdle while reversing the previous day’s U-turn from the highest level in a week, as well as pares the first daily loss in five.
That said, Australia’s trade surplus rises to 11,791M MoM for May, compared with the expectations of 10,500M and 11,158M prior. Further, Exports grow 4.0% on a monthly basis while reversing the previous contraction of 5.0%. On the same line, imports rises 2% MoM and seasonally adjusted vs. 2.0% booked in April.
Also read: Australia Trade Surplus increases in May, AUD/USD remains pressured around mid-0.6600s
While the latest Aussie data lures AUD/USD buyers, the broad risk-off mood and the previous day’s rejection of a one-week-old bullish channel join the bearish MACD signals to keep the pair sellers hopeful.
That said, the latest recovery needs to reverse from the 50-SMA hurdle surrounding 0.6665, if not the stated channel’s bottom line of around 0.6670 and the 200-SMA level of near 0.6675 could challenge the AUD/USD bulls afterward.
It should be noted that the risk-barometer pair’s recovery past 0.6675 needs validation from a downward-sloping resistance line from June 27, close to the 0.6700 round figure, to convince the buyers.
Meanwhile, a one-week-old horizontal support zone around 0.6640-35 restricts the immediate downside of the AUD/USD pair before directing it towards the previous weekly bottom of 0.6595.
Following that, March’s low of near 0.6565 can act as the last defense of the AUD/USD buyers before highlighting the fears of witnessing a fresh yearly low, currently around 0.6460.
Trend: Bearish
Technical Levels: Supports and Resistances
AUDUSD currently trading at 0.6663 at the time of writing. Pair opened at 0.6655 and is trading with a change of 0.12% % .
| Overview | Overview.1 | |
|---|---|---|
| 0 | Today last price | 0.6663 |
| 1 | Today Daily Change | 0.0008 |
| 2 | Today Daily Change % | 0.12% |
| 3 | Today daily open | 0.6655 |
The pair remains strongly bearish on the daily time frame. It trades below the 20 SMA @ 0.6733, 50 SMA 0.6676, 100 SMA @ 0.6692 and 200 SMA @ 0.6695.
| Trends | Trends.1 | |
|---|---|---|
| 0 | Daily SMA20 | 0.6733 |
| 1 | Daily SMA50 | 0.6676 |
| 2 | Daily SMA100 | 0.6692 |
| 3 | Daily SMA200 | 0.6695 |
The previous day high was 0.6698 while the previous day low was 0.6653. The daily 38.2% Fib levels comes at 0.667, expected to provide resistance. Similarly, the daily 61.8% fib level is at 0.6681, expected to provide resistance.
Note the levels of interest below:
- Pivot support is noted at 0.6639, 0.6623, 0.6594
- Pivot resistance is noted at 0.6684, 0.6714, 0.673
| Levels | Levels.1 |
|---|---|
| Previous Daily High | 0.6698 |
| Previous Daily Low | 0.6653 |
| Previous Weekly High | 0.6721 |
| Previous Weekly Low | 0.6595 |
| Previous Monthly High | 0.6900 |
| Previous Monthly Low | 0.6484 |
| Daily Fibonacci 38.2% | 0.6670 |
| Daily Fibonacci 61.8% | 0.6681 |
| Daily Pivot Point S1 | 0.6639 |
| Daily Pivot Point S2 | 0.6623 |
| Daily Pivot Point S3 | 0.6594 |
| Daily Pivot Point R1 | 0.6684 |
| Daily Pivot Point R2 | 0.6714 |
| Daily Pivot Point R3 | 0.6730 |
[/s2If]
Nehcap Expert Advisor
The NEHCAP MT4 EA is high quality professional trading system geared to generate returns without using GRID or martingales. Each trade has strict risk per trade parameter. The pairs under management include EURUSD, GBPUSD, AUDCAD, AUDNZD,GBPAUD, EURAUD, EURCAD, CHFJPY and many more.
The system is trading live: LIVE ACCOUNT TRACKING
You can run it free. Apply for a free trial and track our account. Buy the system or use profit share mechanism to generate returns on your MT4.
Join Our Telegram Group
")


