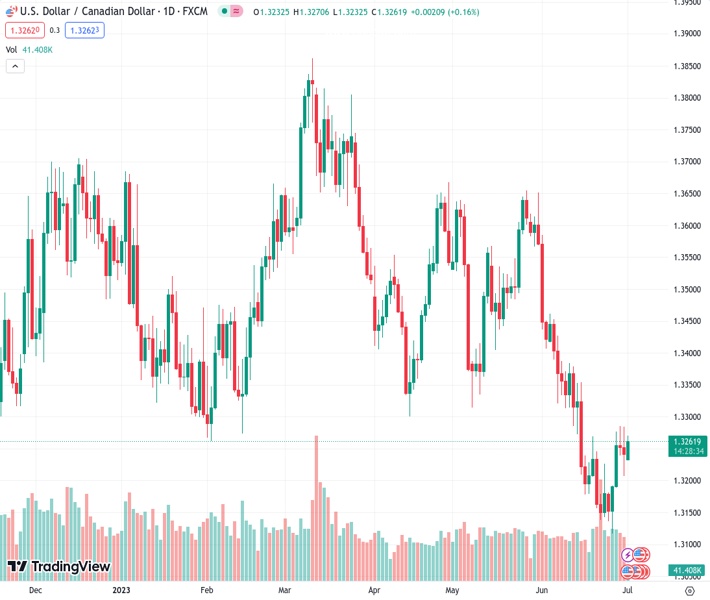
The USDCAD pair is facing difficulty in determining its next move as it is caught between the 50-day Exponential Moving Average (EMA) and a resistance line that has been in place for the past 12 days. The perspective from @nehcap suggests that there is an anticipation for a decline in the value of the currency pair.
…
This is a premium post.
[s2If !current_user_can(access_s2member_level4)]Please register for FREE REGISTER to read full post below containing analysis. In case of any error or you think you are not able to read the full post below, please email us at support#nehcap.com [lwa][/s2If] [s2If current_user_can(access_s2member_level1)]
- USD/CAD struggles for clear directions between 50-EMA and 12-day-old resistance line.
The pair currently trades last at 1.32628.
The previous day high was 1.3285 while the previous day low was 1.3207. The daily 38.2% Fib levels comes at 1.3255, expected to provide support. Similarly, the daily 61.8% fib level is at 1.3237, expected to provide support.
USD/CAD remains sidelined near 1.3250-60 despite picking up bids ahead of Monday’s European session. In doing so, the Loonie pair stays within a short-term trading range comprising the 50-Exponential Moving Average (EMA) and an upward-sloping resistance line from mid-June.
It’s worth noting the quote’s successful upside break of the one-month-old previous resistance line joins a U-turn from the 50-EMA to keep the USD/CAD buyers hopeful. However, the stated 200-EMA and bearish MACD signals challenge the pair’s advances.
Hence, the Loonie pair remains on the bear’s radar unless it stays below the 200-EMA level of around 1.3330. That said, the fortnight-old resistance line guards the immediate upside of the quote near 1.3290.
In a case where the USD/CAD price crosses the 1.3330 hurdle, the June 12 swing high of near 1.3385 will act as the last defense of the bears.
Alternatively, the 50-EMA and the aforementioned resistance-turned support line from June 05, respectively near 1.3230 and 1.3170, limits the nearby downside of the USD/CAD pair.
Following that, the yearly low marked in the last week around 1.3115 and the 1.3000 psychological magnet will gain the market’s attention.
Trend: Downside expected
Technical Levels: Supports and Resistances
USDCAD currently trading at 1.3263 at the time of writing. Pair opened at 1.3248 and is trading with a change of 0.11% % .
| Overview | Overview.1 | |
|---|---|---|
| 0 | Today last price | 1.3263 |
| 1 | Today Daily Change | 0.0015 |
| 2 | Today Daily Change % | 0.11% |
| 3 | Today daily open | 1.3248 |
The pair remains strongly bearish on the daily time frame. It trades below the 20 SMA @ 1.327, 50 SMA 1.3423, 100 SMA @ 1.3495 and 200 SMA @ 1.3514.
| Trends | Trends.1 | |
|---|---|---|
| 0 | Daily SMA20 | 1.3270 |
| 1 | Daily SMA50 | 1.3423 |
| 2 | Daily SMA100 | 1.3495 |
| 3 | Daily SMA200 | 1.3514 |
The previous day high was 1.3285 while the previous day low was 1.3207. The daily 38.2% Fib levels comes at 1.3255, expected to provide support. Similarly, the daily 61.8% fib level is at 1.3237, expected to provide support.
Note the levels of interest below:
- Pivot support is noted at 1.3209, 1.3169, 1.313
- Pivot resistance is noted at 1.3287, 1.3325, 1.3365
| Levels | Levels.1 |
|---|---|
| Previous Daily High | 1.3285 |
| Previous Daily Low | 1.3207 |
| Previous Weekly High | 1.3285 |
| Previous Weekly Low | 1.3117 |
| Previous Monthly High | 1.3585 |
| Previous Monthly Low | 1.3117 |
| Daily Fibonacci 38.2% | 1.3255 |
| Daily Fibonacci 61.8% | 1.3237 |
| Daily Pivot Point S1 | 1.3209 |
| Daily Pivot Point S2 | 1.3169 |
| Daily Pivot Point S3 | 1.3130 |
| Daily Pivot Point R1 | 1.3287 |
| Daily Pivot Point R2 | 1.3325 |
| Daily Pivot Point R3 | 1.3365 |
[/s2If]
Nehcap Expert Advisor
The NEHCAP MT4 EA is high quality professional trading system geared to generate returns without using GRID or martingales. Each trade has strict risk per trade parameter. The pairs under management include EURUSD, GBPUSD, AUDCAD, AUDNZD,GBPAUD, EURAUD, EURCAD, CHFJPY and many more.
The system is trading live: LIVE ACCOUNT TRACKING
You can run it free. Apply for a free trial and track our account. Buy the system or use profit share mechanism to generate returns on your MT4.
Join Our Telegram Group
")


