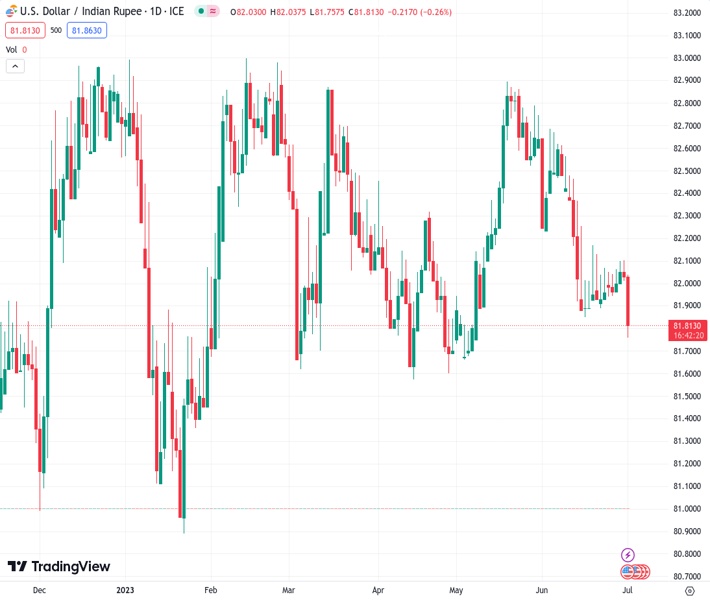
The USD to INR exchange rate at 81.8330 experienced a significant daily decline, marking the largest loss seen since early June, due to the breaking of a crucial support level.
…
This is a premium post.
[s2If !current_user_can(access_s2member_level4)]Please register for FREE REGISTER to read full post below containing analysis. In case of any error or you think you are not able to read the full post below, please email us at support#nehcap.com [lwa][/s2If] [s2If current_user_can(access_s2member_level1)]
- USD/INR prints the biggest daily loss on a day, so far, since early June on breaking the key support.
The pair currently trades last at 81.8330.
The previous day high was 82.1966 while the previous day low was 82.0075. The daily 38.2% Fib levels comes at 82.1243, expected to provide resistance. Similarly, the daily 61.8% fib level is at 82.0797, expected to provide resistance.
USD/INR drops to the lowest levels since early May after breaking the short-term key support, backed by upbeat Indian fundamentals, amid Monday morning in Europe.
That said, an upward-sloping trend line from November 2022 has been restricting the Indian Rupee (INR) pair’s downside of late and hence the latest break of the same triggered the quote’s slump towards the multi-day low.
Adding strength to the USD/INR downside momentum is the news that the Foreign Portfolio Investors (FPIs) have parked the biggest sum in 10 months in India, not to forget marking the fourth consecutive advance. “The foreign portfolio investors (FPIs) pumped in ₹47,148 crore in Indian equities in June, the highest monthly buying of the year,” said The Mint.
While cheering a technical breakdown and the heavy equity flow that propels India’s benchmark equity gauges to an all-time high, the USD/INR pair ignores upbeat prices of WTI crude oil. WTI crude oil rises for the fourth consecutive day to $70.65 by the press time, up 0.34% intraday at the latest. It’s worth observing that India’s heavy reliance on energy imports makes the INR vulnerable to Oil price moves.
Not only the Oil price but the US Dollar’s rebound also fails to inspire the USD/INR buyers. The reason could be linked to Friday’s downbeat performance of the Fed’s favorite inflation numbers, namely the US Personal Consumption Expenditure (PCE) Price Index for May, as well as softer outcomes of the US spending survey released previously. With this, the US Dollar Index (DXY) prints mild gains around 103.00, reversing the previous day’s pullback from a two-week high.
Elsewhere, the US Treasury Secretary Janet Yellen’s China visit during July 06-09 period witnessed mixed responses from the market. While the news appears positive for the sentiment on the front, the details seem less impressive as US Treasury Secretary Yellen is likely to flag concerns about human rights abuses against the Uyghur Muslim minority, China’s recent move to ban sales of Micron Technology memory chips, and moves by China against foreign due diligence and consulting firms, per Reuters.
Having witnessed the initial market reaction to the trend line breakout and upbeat fundamentals, the USD/INR traders should pay attention to the US ISM Manufacturing PMI and other risk catalysts for intraday directions. However, major attention will be given to Fed Minutes and US Nonfarm Payrolls (NFP) report for a clear guide.
A clear downside break of an eight-month-old rising support line, now immediate resistance near 81.95, directs the USD/INR bears toward the April month’s bottom of around 81.60.
Technical Levels: Supports and Resistances
USDINR currently trading at 81.812 at the time of writing. Pair opened at 82.0964 and is trading with a change of -0.35% % .
| Overview | Overview.1 | |
|---|---|---|
| 0 | Today last price | 81.812 |
| 1 | Today Daily Change | -0.2844 |
| 2 | Today Daily Change % | -0.35% |
| 3 | Today daily open | 82.0964 |
The pair remains strongly bearish on the daily time frame. It trades below the 20 SMA @ 82.1534, 50 SMA 82.2023, 100 SMA @ 82.2546 and 200 SMA @ 82.1515.
| Trends | Trends.1 | |
|---|---|---|
| 0 | Daily SMA20 | 82.1534 |
| 1 | Daily SMA50 | 82.2023 |
| 2 | Daily SMA100 | 82.2546 |
| 3 | Daily SMA200 | 82.1515 |
The previous day high was 82.1966 while the previous day low was 82.0075. The daily 38.2% Fib levels comes at 82.1243, expected to provide resistance. Similarly, the daily 61.8% fib level is at 82.0797, expected to provide resistance.
Note the levels of interest below:
- Pivot support is noted at 82.0037, 81.9111, 81.8147
- Pivot resistance is noted at 82.1928, 82.2892, 82.3818
| Levels | Levels.1 |
|---|---|
| Previous Daily High | 82.1966 |
| Previous Daily Low | 82.0075 |
| Previous Weekly High | 82.2590 |
| Previous Weekly Low | 81.9393 |
| Previous Monthly High | 82.7370 |
| Previous Monthly Low | 81.8477 |
| Daily Fibonacci 38.2% | 82.1243 |
| Daily Fibonacci 61.8% | 82.0797 |
| Daily Pivot Point S1 | 82.0037 |
| Daily Pivot Point S2 | 81.9111 |
| Daily Pivot Point S3 | 81.8147 |
| Daily Pivot Point R1 | 82.1928 |
| Daily Pivot Point R2 | 82.2892 |
| Daily Pivot Point R3 | 82.3818 |
[/s2If]
Nehcap Expert Advisor
The NEHCAP MT4 EA is high quality professional trading system geared to generate returns without using GRID or martingales. Each trade has strict risk per trade parameter. The pairs under management include EURUSD, GBPUSD, AUDCAD, AUDNZD,GBPAUD, EURAUD, EURCAD, CHFJPY and many more.
The system is trading live: LIVE ACCOUNT TRACKING
You can run it free. Apply for a free trial and track our account. Buy the system or use profit share mechanism to generate returns on your MT4.
Join Our Telegram Group
")


