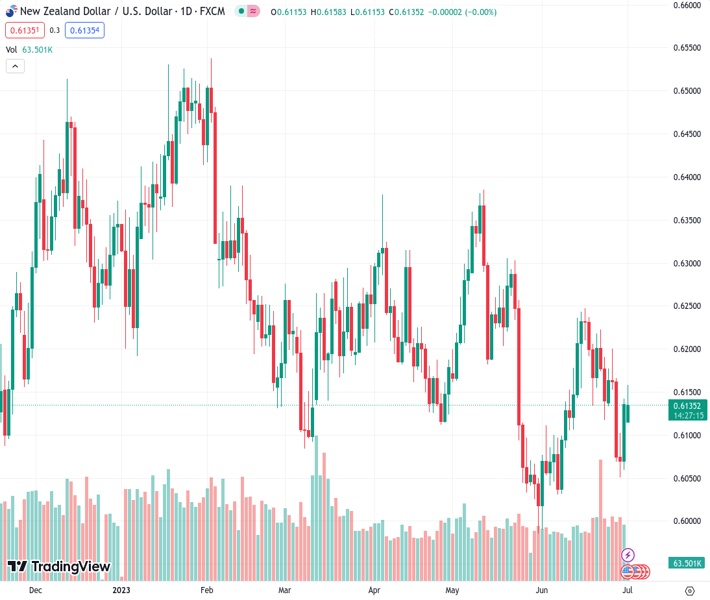
The NZDUSD pair, currently trading at 0.61330, has experienced a slight increase in selling activity near its three-day peak of 0.6160.
…
This is a premium post.
[s2If !current_user_can(access_s2member_level4)]Please register for FREE REGISTER to read full post below containing analysis. In case of any error or you think you are not able to read the full post below, please email us at support#nehcap.com [lwa][/s2If] [s2If current_user_can(access_s2member_level1)]
- NZD/USD has sensed marginal selling pressure around a three-day high at 0.6160.
The pair currently trades last at 0.61330.
The previous day high was 0.6143 while the previous day low was 0.6059. The daily 38.2% Fib levels comes at 0.6111, expected to provide support. Similarly, the daily 61.8% fib level is at 0.6091, expected to provide support.
The NZD/USD pair has faced some pressure after printing a fresh three-day high at 0.6160 in the early European session. The Kiwi asset is still possessing strength as the Caixin Manufacturing PMI data has outperformed expectations. The economic data landed at 50.5 higher than the expectations of 50.2 but remained lower than the prior release of 50.9.
It is worth noting that New Zealand is one of the leading trading partners to China and higher manufacturing activities in China support the New Zealand Dollar.
The US Dollar Index (DXY) is looking to climb above 103.00 as investors are awaiting the release of the United States ISM Manufacturing PMI data for further guidance.
NZD/USD is approaching the downward-sloping trendline plotted from June 15 high at 0.6250 on a four-hour scale. The Kiwi asset is facing barricades around the 200-period Exponential Moving Average (EMA) at 0.6150, which indicates that the long-term trend has not turned bullish yet. Horizontal resistance is placed from May 19 high at 0.6306.
The Relative Strength Index (RSI) is making efforts to shift into the bullish range of 60.00-80.00. An occurrence of the same would strengthen the New Zealand Dollar bulls.
Going forward, a decisive break above June 27 high at 0.6200 will drive the asset towards June 14 high at 0.6236 followed by May 17 high at 0.6274.
Alternatively, a downside move below June 23 low at 0.6116 will expose the asset June 05 low at 0.6041. A slippage below the latter would expose the asset to psychological support at 0.6000.
Technical Levels: Supports and Resistances
NZDUSD currently trading at 0.6137 at the time of writing. Pair opened at 0.6111 and is trading with a change of 0.43 % .
| Overview | Overview.1 | |
|---|---|---|
| 0 | Today last price | 0.6137 |
| 1 | Today Daily Change | 0.0026 |
| 2 | Today Daily Change % | 0.4300 |
| 3 | Today daily open | 0.6111 |
The pair remains strongly bearish on the daily time frame. It trades below the 20 SMA @ 0.614, 50 SMA 0.6167, 100 SMA @ 0.6195 and 200 SMA @ 0.6162.
| Trends | Trends.1 | |
|---|---|---|
| 0 | Daily SMA20 | 0.6140 |
| 1 | Daily SMA50 | 0.6167 |
| 2 | Daily SMA100 | 0.6195 |
| 3 | Daily SMA200 | 0.6162 |
The previous day high was 0.6143 while the previous day low was 0.6059. The daily 38.2% Fib levels comes at 0.6111, expected to provide support. Similarly, the daily 61.8% fib level is at 0.6091, expected to provide support.
Note the levels of interest below:
- Pivot support is noted at 0.6066, 0.602, 0.5982
- Pivot resistance is noted at 0.615, 0.6188, 0.6234
| Levels | Levels.1 |
|---|---|
| Previous Daily High | 0.6143 |
| Previous Daily Low | 0.6059 |
| Previous Weekly High | 0.6202 |
| Previous Weekly Low | 0.6050 |
| Previous Monthly High | 0.6250 |
| Previous Monthly Low | 0.5990 |
| Daily Fibonacci 38.2% | 0.6111 |
| Daily Fibonacci 61.8% | 0.6091 |
| Daily Pivot Point S1 | 0.6066 |
| Daily Pivot Point S2 | 0.6020 |
| Daily Pivot Point S3 | 0.5982 |
| Daily Pivot Point R1 | 0.6150 |
| Daily Pivot Point R2 | 0.6188 |
| Daily Pivot Point R3 | 0.6234 |
[/s2If]
Nehcap Expert Advisor
The NEHCAP MT4 EA is high quality professional trading system geared to generate returns without using GRID or martingales. Each trade has strict risk per trade parameter. The pairs under management include EURUSD, GBPUSD, AUDCAD, AUDNZD,GBPAUD, EURAUD, EURCAD, CHFJPY and many more.
The system is trading live: LIVE ACCOUNT TRACKING
You can run it free. Apply for a free trial and track our account. Buy the system or use profit share mechanism to generate returns on your MT4.
Join Our Telegram Group
")


