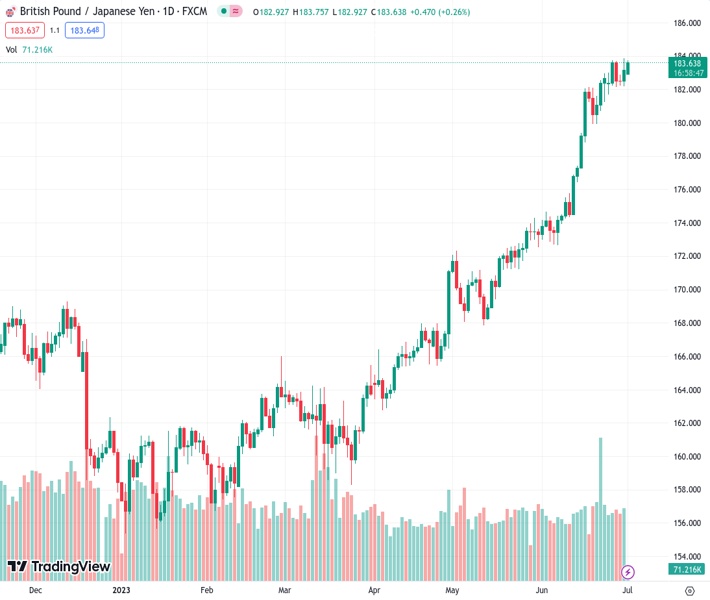
The GBPJPY pair begins the week with a positive start at a rate of 183.659, moving closer to its highest level in several years.
…
This is a premium post.
[s2If !current_user_can(access_s2member_level4)]Please register for FREE REGISTER to read full post below containing analysis. In case of any error or you think you are not able to read the full post below, please email us at support#nehcap.com [lwa][/s2If] [s2If current_user_can(access_s2member_level1)]
- GBP/JPY kicks off the new week on a positive note and climbs back closer to the multi-year peak.
The pair currently trades last at 183.659.
The previous day high was 183.88 while the previous day low was 182.2. The daily 38.2% Fib levels comes at 183.24, expected to provide support. Similarly, the daily 61.8% fib level is at 182.84, expected to provide support.
The GBP/JPY cross attracts fresh buyers on the first day of a new week and steadily climbs back closer to its highest level since December 2015 touched on Friday. Spot prices currently trade around the 183.70-183.65 region, up over 0.20% for the day, and seem poised to prolong the recent well-established uptrend witnessed over the past three months or so.
The Japanese Yen (JPY) continues with its relative underperformance in the wake of a more dovish stance adopted by the Bank of Japan (BoJ) and turns out to be a key factor lending support to the GBP/JPY cross. In fact, market participants seem convinced that BoJ’s negative interest-rate policy will remain in place at least until next year. Moreover, BoJ Governor Kazuo Ueda recently ruled out the possibility of any change in ultra-loose policy settings and signalled no immediate plans to alter the yield curve control measures.
In contrast, the Bank of England (BoE) Governor Andrew Bailey said last week that rates could remain at peak levels for longer than traders currently expect. Apart from this, a generally positive tone around the equity markets is seen undermining the safe-haven JPY and further acting as a tailwind for the GBP/JPY cross. That said, worries about economic headwinds stemming from rapidly rising borrowing costs might keep a lid on any further appreciating move against the backdrop of fears of an intervention by Japanese authorities.
Concerns that the British economy is heading for a recession mounted sharply following a surprise 50 bps rate hike by the BoE in June. This, in, might hold back traders from placing aggressive bullish bets around the British Pound and cap gains for the GBP/JPY cross in the wake of overbought technical indicators on the daily chart. Market participants now look forward to the release of the final UK Manufacturing PMI for a fresh impetus. Nevertheless, the aforementioned supportive fundamental backdrop still seems tilted in favour of bulls.
Technical Levels: Supports and Resistances
GBPJPY currently trading at 183.69 at the time of writing. Pair opened at 183.27 and is trading with a change of 0.23 % .
| Overview | Overview.1 | |
|---|---|---|
| 0 | Today last price | 183.69 |
| 1 | Today Daily Change | 0.42 |
| 2 | Today Daily Change % | 0.23 |
| 3 | Today daily open | 183.27 |
The pair remains strongly bullish on the daily timeframe. It trades above its 20 SMA @ 179.22, 50 SMA 174.19, 100 SMA @ 168.73 and 200 SMA @ 166.08.
| Trends | Trends.1 | |
|---|---|---|
| 0 | Daily SMA20 | 179.22 |
| 1 | Daily SMA50 | 174.19 |
| 2 | Daily SMA100 | 168.73 |
| 3 | Daily SMA200 | 166.08 |
The previous day high was 183.88 while the previous day low was 182.2. The daily 38.2% Fib levels comes at 183.24, expected to provide support. Similarly, the daily 61.8% fib level is at 182.84, expected to provide support.
Note the levels of interest below:
- Pivot support is noted at 182.36, 181.44, 180.68
- Pivot resistance is noted at 184.03, 184.79, 185.71
| Levels | Levels.1 |
|---|---|
| Previous Daily High | 183.88 |
| Previous Daily Low | 182.20 |
| Previous Weekly High | 183.88 |
| Previous Weekly Low | 181.69 |
| Previous Monthly High | 183.88 |
| Previous Monthly Low | 172.67 |
| Daily Fibonacci 38.2% | 183.24 |
| Daily Fibonacci 61.8% | 182.84 |
| Daily Pivot Point S1 | 182.36 |
| Daily Pivot Point S2 | 181.44 |
| Daily Pivot Point S3 | 180.68 |
| Daily Pivot Point R1 | 184.03 |
| Daily Pivot Point R2 | 184.79 |
| Daily Pivot Point R3 | 185.71 |
[/s2If]
Nehcap Expert Advisor
The NEHCAP MT4 EA is high quality professional trading system geared to generate returns without using GRID or martingales. Each trade has strict risk per trade parameter. The pairs under management include EURUSD, GBPUSD, AUDCAD, AUDNZD,GBPAUD, EURAUD, EURCAD, CHFJPY and many more.
The system is trading live: LIVE ACCOUNT TRACKING
You can run it free. Apply for a free trial and track our account. Buy the system or use profit share mechanism to generate returns on your MT4.
Join Our Telegram Group
")


