The EURUSD currency pair remains stable above the 1.0900 level but faces difficulties in attracting potential buyers.
…
This is a premium post.
[s2If !current_user_can(access_s2member_level4)]Please register for FREE REGISTER to read full post below containing analysis. In case of any error or you think you are not able to read the full post below, please email us at support#nehcap.com [lwa][/s2If] [s2If current_user_can(access_s2member_level1)]
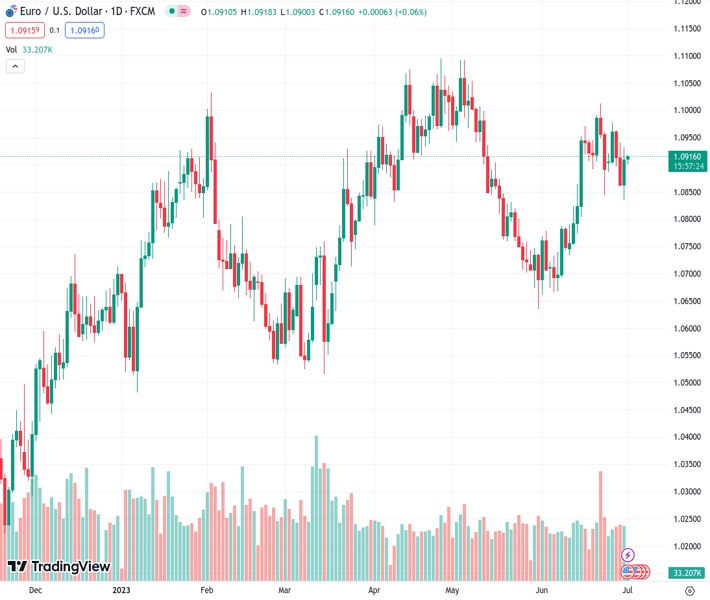
- EUR/USD holds steady above the 1.0900 mark, though struggles to attract any buyers.
The pair currently trades last at 1.09158.
The previous day high was 1.0932 while the previous day low was 1.0835. The daily 38.2% Fib levels comes at 1.0895, expected to provide support. Similarly, the daily 61.8% fib level is at 1.0872, expected to provide support.
The EUR/USD pair struggles to gain any meaningful traction on the first day of the new week and oscillates in a narrow trading band through the Asian session. Spot prices, however, manage to defend the 1.0900 mark, though remain below the 200-hour Simple Moving Average (SMA) resistance, warranting caution before positioning for an extension of Friday’s goodish rebound from a two-week low.
The shared currency continues to draw some support from rising bets for another 25 bps lift-off by the European Central Bank (ECB) in July and turns out to be a key factor lending some support to the EUR/USD pair. The preliminary report published by Eurostat showed that the annual Euro Zone Harmonised Index of Consumer Prices (HICP) decelerated from 6.1% to 5.5% in June. That said, the Core HICP rose by 0.3% MoM and edged higher to the 5.4% YoY rate, reaffirming expectations for more rate hikes by the ECB in the coming months.
That said, the emergence of some US Dollar (USD) buying, supported by the Federal Reserve’s (Fed) hawkish stance, is holding back bulls from placing aggressive bets around the EUR/USD pair and acting as a headwind. It is worth recalling Fed Chair Jerome Powell reiterated last week that borrowing costs may still need to rise as much as 50 bps by the end of this year. Moreover, the current market pricing indicates a nearly 85% chance of a 25 bps lift-off at the July FOMC meeting and the bets were reaffirmed by Friday’s mixed US PCE Price Index.
In fact, the Bureau of Economic Analysis reported that the annual PCE Price Index decelerated to 3.8% in May from 4.3% in the previous month. Additional details showed the Core PCE Price Index, excluding the volatile food and energy components, ticked down to 4.6% during the reported month from 4.7% in April. The gauge, however, remains well above the Fed’s 2% target and supports prospects for further policy tightening. This remains supportive of elevated US Treasury bond yields, which lend support to the USD and cap the EUR/USD pair.
Apart from this, worries about economic headwinds stemming from rapidly rising borrowing costs warrant some caution for bullish traders ahead of this week’s important macro releases, starting with the US ISM Manufacturing PMI on Monday. The focus, meanwhile, will remain glued to the FOMC meeting minutes on Wednesday, which will be followed by the closely-watched US monthly employment details – popularly known as NFP. This will play a key role in influencing the USD and provide a fresh directional impetus to the EUR/USD pair.
Technical Levels: Supports and Resistances
EURUSD currently trading at 1.0916 at the time of writing. Pair opened at 1.091 and is trading with a change of 0.05 % .
| Overview | Overview.1 | |
|---|---|---|
| 0 | Today last price | 1.0916 |
| 1 | Today Daily Change | 0.0006 |
| 2 | Today Daily Change % | 0.0500 |
| 3 | Today daily open | 1.0910 |
The pair remains strongly bullish on the daily timeframe. It trades above its 20 SMA @ 1.0857, 50 SMA 1.0871, 100 SMA @ 1.0819 and 200 SMA @ 1.0591.
| Trends | Trends.1 | |
|---|---|---|
| 0 | Daily SMA20 | 1.0857 |
| 1 | Daily SMA50 | 1.0871 |
| 2 | Daily SMA100 | 1.0819 |
| 3 | Daily SMA200 | 1.0591 |
The previous day high was 1.0932 while the previous day low was 1.0835. The daily 38.2% Fib levels comes at 1.0895, expected to provide support. Similarly, the daily 61.8% fib level is at 1.0872, expected to provide support.
Note the levels of interest below:
- Pivot support is noted at 1.0853, 1.0796, 1.0756
- Pivot resistance is noted at 1.095, 1.0989, 1.1046
| Levels | Levels.1 |
|---|---|
| Previous Daily High | 1.0932 |
| Previous Daily Low | 1.0835 |
| Previous Weekly High | 1.0977 |
| Previous Weekly Low | 1.0835 |
| Previous Monthly High | 1.1012 |
| Previous Monthly Low | 1.0662 |
| Daily Fibonacci 38.2% | 1.0895 |
| Daily Fibonacci 61.8% | 1.0872 |
| Daily Pivot Point S1 | 1.0853 |
| Daily Pivot Point S2 | 1.0796 |
| Daily Pivot Point S3 | 1.0756 |
| Daily Pivot Point R1 | 1.0950 |
| Daily Pivot Point R2 | 1.0989 |
| Daily Pivot Point R3 | 1.1046 |
[/s2If]
Nehcap Expert Advisor
The NEHCAP MT4 EA is high quality professional trading system geared to generate returns without using GRID or martingales. Each trade has strict risk per trade parameter. The pairs under management include EURUSD, GBPUSD, AUDCAD, AUDNZD,GBPAUD, EURAUD, EURCAD, CHFJPY and many more.
The system is trading live: LIVE ACCOUNT TRACKING
You can run it free. Apply for a free trial and track our account. Buy the system or use profit share mechanism to generate returns on your MT4.
Join Our Telegram Group
")


