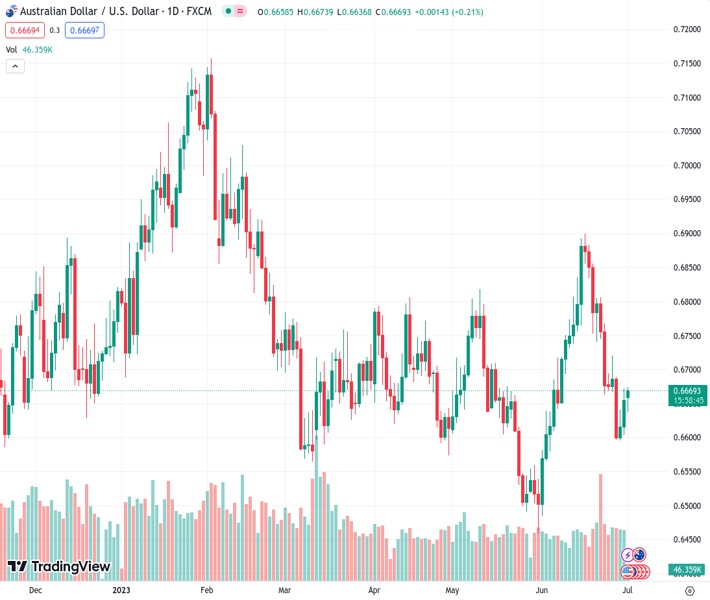
The Australian Dollar to US Dollar exchange rate is fluctuating near its highest point of the day, but is finding it difficult to maintain its three-day winning streak within a short-term upward trend. A market analyst predicts that there is not much potential for further gains in the near future.
…
This is a premium post.
[s2If !current_user_can(access_s2member_level4)]Please register for FREE REGISTER to read full post below containing analysis. In case of any error or you think you are not able to read the full post below, please email us at support#nehcap.com [lwa][/s2If] [s2If current_user_can(access_s2member_level1)]
- AUD/USD seesaws around intraday high, struggles to defend three-day winning streak within immediate rising trend channel.
The pair currently trades last at 0.66705.
The previous day high was 0.6672 while the previous day low was 0.6603. The daily 38.2% Fib levels comes at 0.6646, expected to provide support. Similarly, the daily 61.8% fib level is at 0.6629, expected to provide support.
AUD/USD bulls struggle around the intraday high of near 0.6665-70 as a short-term key upside hurdle prods the risk-barometer pair’s three-day winning streak amid early Monday in Europe. In doing so, the Aussie pair justifies the trader’s anxiety ahead of Tuesday’s Reserve Bank of Australia (RBA) Interest Rate Decision.
That said, the AUD/USD pair’s latest run-up could be linked to its ability to recover from the 100-Hour Moving Average (HMA). Adding strength to the upside bias is the quote’s sustained break of a downward-sloping resistance line from June 16, now support near 0.6620.
However, an upward-sloping trend channel since the last Wednesday, currently between 0.6670 and 0.6615, restricts the quote’s immediate upside.
It’s worth noting that the major currency pair’s run-up beyond 0.6670 needs validation from the 200-HMA hurdle of around 0.6690, as well as the 0.6700 round figure, to convince the AUD/USD bulls.
Even so, the previous weekly high of 0.6720 can challenge the pair ahead of directing the run-up toward the 0.6800 round figure and then to the last monthly peak of near 0.6820.
Meanwhile, the 100-HMA and the previous resistance line, respectively near 0.6645 and 0.6620, restrict the short-term downside of the AUD/USD pair.
Following that, the stated channel’s bottom line and the monthly low, close to 0.6615 and 0.6595 in that order, will act as the final defense of the Aussie pair bears.
Trend: Limited upside expected
Technical Levels: Supports and Resistances
AUDUSD currently trading at 0.6667 at the time of writing. Pair opened at 0.6665 and is trading with a change of 0.03% % .
| Overview | Overview.1 | |
|---|---|---|
| 0 | Today last price | 0.6667 |
| 1 | Today Daily Change | 0.0002 |
| 2 | Today Daily Change % | 0.03% |
| 3 | Today daily open | 0.6665 |
The pair remains strongly bearish on the daily time frame. It trades below the 20 SMA @ 0.6729, 50 SMA 0.6674, 100 SMA @ 0.67 and 200 SMA @ 0.6692.
| Trends | Trends.1 | |
|---|---|---|
| 0 | Daily SMA20 | 0.6729 |
| 1 | Daily SMA50 | 0.6674 |
| 2 | Daily SMA100 | 0.6700 |
| 3 | Daily SMA200 | 0.6692 |
The previous day high was 0.6672 while the previous day low was 0.6603. The daily 38.2% Fib levels comes at 0.6646, expected to provide support. Similarly, the daily 61.8% fib level is at 0.6629, expected to provide support.
Note the levels of interest below:
- Pivot support is noted at 0.6622, 0.6578, 0.6553
- Pivot resistance is noted at 0.669, 0.6715, 0.6758
| Levels | Levels.1 |
|---|---|
| Previous Daily High | 0.6672 |
| Previous Daily Low | 0.6603 |
| Previous Weekly High | 0.6721 |
| Previous Weekly Low | 0.6595 |
| Previous Monthly High | 0.6900 |
| Previous Monthly Low | 0.6484 |
| Daily Fibonacci 38.2% | 0.6646 |
| Daily Fibonacci 61.8% | 0.6629 |
| Daily Pivot Point S1 | 0.6622 |
| Daily Pivot Point S2 | 0.6578 |
| Daily Pivot Point S3 | 0.6553 |
| Daily Pivot Point R1 | 0.6690 |
| Daily Pivot Point R2 | 0.6715 |
| Daily Pivot Point R3 | 0.6758 |
[/s2If]
Nehcap Expert Advisor
The NEHCAP MT4 EA is high quality professional trading system geared to generate returns without using GRID or martingales. Each trade has strict risk per trade parameter. The pairs under management include EURUSD, GBPUSD, AUDCAD, AUDNZD,GBPAUD, EURAUD, EURCAD, CHFJPY and many more.
The system is trading live: LIVE ACCOUNT TRACKING
You can run it free. Apply for a free trial and track our account. Buy the system or use profit share mechanism to generate returns on your MT4.
Join Our Telegram Group
")


