The USDINR is hovering close to its highest point of the day and has recorded its largest daily increase in three weeks.
…
This is a premium post.
[s2If !current_user_can(access_s2member_level4)]Please register for FREE REGISTER to read full post below containing analysis. In case of any error or you think you are not able to read the full post below, please email us at support#nehcap.com [lwa][/s2If] [s2If current_user_can(access_s2member_level1)]
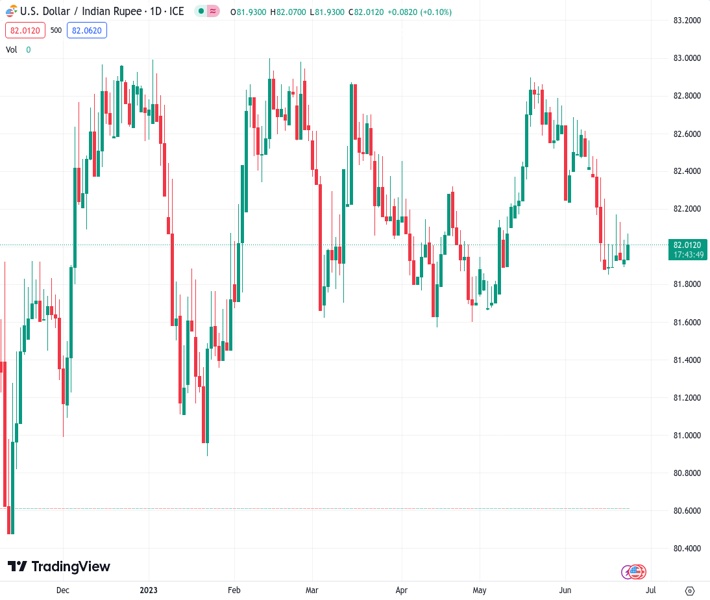
- USD/INR grinds near intraday high while positing the biggest daily gains in three weeks.
The pair currently trades last at 82.0300.
The previous day high was 82.0841 while the previous day low was 81.8845. The daily 38.2% Fib levels comes at 81.9608, expected to provide support. Similarly, the daily 61.8% fib level is at 82.0079, expected to provide support.
USD/INR bulls are back with a bang as the Indian Rupee (INR) prints the biggest daily slump, so far, in three weeks amid early Friday. That said, the pair buyers push the intraday high of near 82.10 while poking the key upside hurdle amid broad US Dollar strength. In doing so, the Indian Rupee fails to cheer the likely improvement in the US-India ties, as well as the downbeat Oil price, amid a risk-off mood.
As Indian Prime Minister (PM) Narendra Modi visit the US, Reuters said that US President Joe Biden and Narendra Modi hailed a new era in their countries’ relationship after the White House rolled out the red carpet for the Indian prime minister on Thursday, touting deals on defense and commerce aimed at countering China’s global influence.
On the other hand, WTI crude oil dropped for the second consecutive day to refresh a weekly low of around $69.00. The black gold dropped the most in a fortnight the previous day after the US Dollar rallied on fears of global economic slowdown and also cheered the hawkish testimony of Fed Chair Jerome Powell. Additionally, the fears of the US-China tension also weigh on the Oil price. It’s worth noting that India’s reliance on energy imports joins the record deficit to make the INR vulnerable to energy price moves.
Elsewhere, the US Dollar Index (DXY) picks up bids to extend the previous day’s rebound from the six-week low to around 102.55 by the press time.
A slew of central banks announced hawkish moves the previous day and bolstered concerns of “higher for longer” rates, which in turn roiled the market sentiment amid fears of economic slowdown and underpinned the US Treasury bond yields and the US Dollar. Further, hawkish testimony from Fed Chair Powell also weighs on the risk profile. Fed Chairman Jerome Powell repeated most of his previous day’s remarks during his testimony 2.0, this time in front of the Senate Housing Committee. Though his statements like, “(It) will be appropriate to raise rates again this year, perhaps two more times,” allowed the US Dollar to refresh the intraday high while eyeing to reverse Wednesday’s losses.
Alternatively, downbeat comments from Thomas Barkin, President of the Federal Reserve Bank of Richmond, as well as US Treasury Secretary Jannet Yellen, prod the US Dollar bulls earlier in the day. That said, Fed’s Barkin showed readiness to vote for rate cuts on conviction of a slowdown in inflation while US Treasury Secretary Yellen flags recession fears as Fed tightens policy.
Looking ahead, news on the US-India ties and the market’s risk catalysts will determine near-term USD/INR moves while the first readings of the US S&P Global PMIs for June can direct intraday traders of the Indian Rupee.
Despite the latest rebound, USD/INR stays within a week-old symmetrical triangle, currently between 82.10 and 81.90. Adding strength to the upside filter around 82.10 is the 200-DMA. That said, a gradual recovery if the RSI (14) line from oversold territory favors the Indian Rupee (INR) bears.
Technical Levels: Supports and Resistances
USDINR currently trading at 82.0521 at the time of writing. Pair opened at 81.9124 and is trading with a change of 0.17% % .
| Overview | Overview.1 | |
|---|---|---|
| 0 | Today last price | 82.0521 |
| 1 | Today Daily Change | 0.1397 |
| 2 | Today Daily Change % | 0.17% |
| 3 | Today daily open | 81.9124 |
The pair remains strongly bearish on the daily time frame. It trades below the 20 SMA @ 82.3072, 50 SMA 82.2085, 100 SMA @ 82.2904 and 200 SMA @ 82.0983.
| Trends | Trends.1 | |
|---|---|---|
| 0 | Daily SMA20 | 82.3072 |
| 1 | Daily SMA50 | 82.2085 |
| 2 | Daily SMA100 | 82.2904 |
| 3 | Daily SMA200 | 82.0983 |
The previous day high was 82.0841 while the previous day low was 81.8845. The daily 38.2% Fib levels comes at 81.9608, expected to provide support. Similarly, the daily 61.8% fib level is at 82.0079, expected to provide support.
Note the levels of interest below:
- Pivot support is noted at 81.8366, 81.7607, 81.6369
- Pivot resistance is noted at 82.0362, 82.16, 82.2358
| Levels | Levels.1 |
|---|---|
| Previous Daily High | 82.0841 |
| Previous Daily Low | 81.8845 |
| Previous Weekly High | 82.5680 |
| Previous Weekly Low | 81.8477 |
| Previous Monthly High | 82.9810 |
| Previous Monthly Low | 81.6435 |
| Daily Fibonacci 38.2% | 81.9608 |
| Daily Fibonacci 61.8% | 82.0079 |
| Daily Pivot Point S1 | 81.8366 |
| Daily Pivot Point S2 | 81.7607 |
| Daily Pivot Point S3 | 81.6369 |
| Daily Pivot Point R1 | 82.0362 |
| Daily Pivot Point R2 | 82.1600 |
| Daily Pivot Point R3 | 82.2358 |
[/s2If]
Nehcap Expert Advisor
The NEHCAP MT4 EA is high quality professional trading system geared to generate returns without using GRID or martingales. Each trade has strict risk per trade parameter. The pairs under management include EURUSD, GBPUSD, AUDCAD, AUDNZD,GBPAUD, EURAUD, EURCAD, CHFJPY and many more.
The system is trading live: LIVE ACCOUNT TRACKING
You can run it free. Apply for a free trial and track our account. Buy the system or use profit share mechanism to generate returns on your MT4.
Join Our Telegram Group
")


