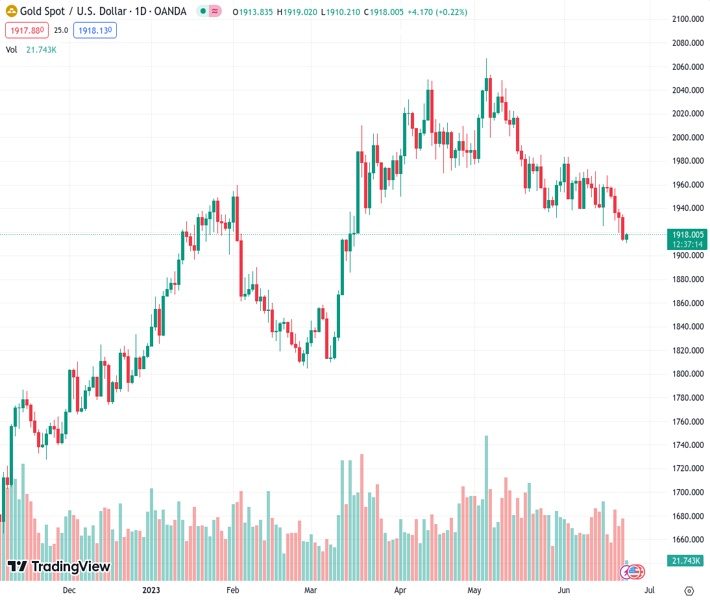
The price of gold, currently at 1,918.59 XAUUSD, has decreased due to the powerful performance of the US Dollar Index.
…
This is a premium post.
[s2If !current_user_can(access_s2member_level4)]Please register for FREE REGISTER to read full post below containing analysis. In case of any error or you think you are not able to read the full post below, please email us at support#nehcap.com [lwa][/s2If] [s2If current_user_can(access_s2member_level1)]
- Gold price has retreated amid sheer strength in the US Dollar Index.
The pair currently trades last at 1918.59.
The previous day high was 1935.06 while the previous day low was 1912.46. The daily 38.2% Fib levels comes at 1921.09, expected to provide resistance. Similarly, the daily 61.8% fib level is at 1926.43, expected to provide resistance.
Gold price (XAU/USD) has witnessed selling pressure around $1,917.50 in the European session. The short-lived pullback in the precious metal has concluded and it is expected to drop back to an intraday low at $1,910.00. A sell-off move in the yellow metal was triggered due to the upbeat US Dollar Index (DXY).
S&P500 futures have carry-forwarded significant losses generated in Asia to Europe as the market mood is quite risk-off. Global growth prospects are under threat as the continuation of the policy-tightening regime by central banks has propelled fears of recession.
The US Dollar Index has stretched its rally to 102.70 as the bleak global outlook has improved its appeal. Meanwhile, fears of more interest rate hikes from the Federal Reserve (Fed) are also keeping the US Dollar in the upside trajectory. Contrary to the strength in the USD Index, US Treasury yields are facing pressure. The 10-year US Treasury yields have dropped to near 3.78%.
Going forward, the release of the preliminary S&P Global PMI data (June) will be keenly watched. A per the prior estimation report, Manufacturing PMI will show a mild increase to 48.5 vs. the prior release of 48.4. Services PMI is seen declining to 54.0 against the former release of 54.9.
Investors should note that US Manufacturing PMI has been contracting consecutively for seven months and further contraction would impact the US Dollar. A figure below 50.0 is considered a contraction in economic activities.
Gold price has demonstrated a sheer fall after a breakdown of the Descending Triangle, which is a volatility contraction chart pattern, formed on a four-hour scale. A breakdown of the aforementioned chart pattern is followed by wider ticks and heavy volume. Later, the asset is expected to find support near $1,886.00.
The precious metal is trading below the 200-period Exponential Moving Average (EMA) at $1,960.00, which indicates that the long-term trend is bearish.
The Relative Strength Index (RSI) (14) is oscillating in the bearish range of 20.00-40.00, which indicates that the downside momentum has been triggered.
Technical Levels: Supports and Resistances
XAUUSD currently trading at 1913.25 at the time of writing. Pair opened at 1913.88 and is trading with a change of -0.03 % .
| Overview | Overview.1 | |
|---|---|---|
| 0 | Today last price | 1913.25 |
| 1 | Today Daily Change | -0.63 |
| 2 | Today Daily Change % | -0.03 |
| 3 | Today daily open | 1913.88 |
The pair is trading below its 20 Daily moving average @ 1951.15, below its 50 Daily moving average @ 1978.98 , below its 100 Daily moving average @ 1942.1 and above its 200 Daily moving average @ 1852.09
| Trends | Trends.1 | |
|---|---|---|
| 0 | Daily SMA20 | 1951.15 |
| 1 | Daily SMA50 | 1978.98 |
| 2 | Daily SMA100 | 1942.10 |
| 3 | Daily SMA200 | 1852.09 |
The previous day high was 1935.06 while the previous day low was 1912.46. The daily 38.2% Fib levels comes at 1921.09, expected to provide resistance. Similarly, the daily 61.8% fib level is at 1926.43, expected to provide resistance.
Note the levels of interest below:
- Pivot support is noted at 1905.87, 1897.87, 1883.27
- Pivot resistance is noted at 1928.47, 1943.07, 1951.07
| Levels | Levels.1 |
|---|---|
| Previous Daily High | 1935.06 |
| Previous Daily Low | 1912.46 |
| Previous Weekly High | 1971.01 |
| Previous Weekly Low | 1924.85 |
| Previous Monthly High | 2079.76 |
| Previous Monthly Low | 1932.12 |
| Daily Fibonacci 38.2% | 1921.09 |
| Daily Fibonacci 61.8% | 1926.43 |
| Daily Pivot Point S1 | 1905.87 |
| Daily Pivot Point S2 | 1897.87 |
| Daily Pivot Point S3 | 1883.27 |
| Daily Pivot Point R1 | 1928.47 |
| Daily Pivot Point R2 | 1943.07 |
| Daily Pivot Point R3 | 1951.07 |
[/s2If]
Nehcap Expert Advisor
The NEHCAP MT4 EA is high quality professional trading system geared to generate returns without using GRID or martingales. Each trade has strict risk per trade parameter. The pairs under management include EURUSD, GBPUSD, AUDCAD, AUDNZD,GBPAUD, EURAUD, EURCAD, CHFJPY and many more.
The system is trading live: LIVE ACCOUNT TRACKING
You can run it free. Apply for a free trial and track our account. Buy the system or use profit share mechanism to generate returns on your MT4.
Join Our Telegram Group
")


