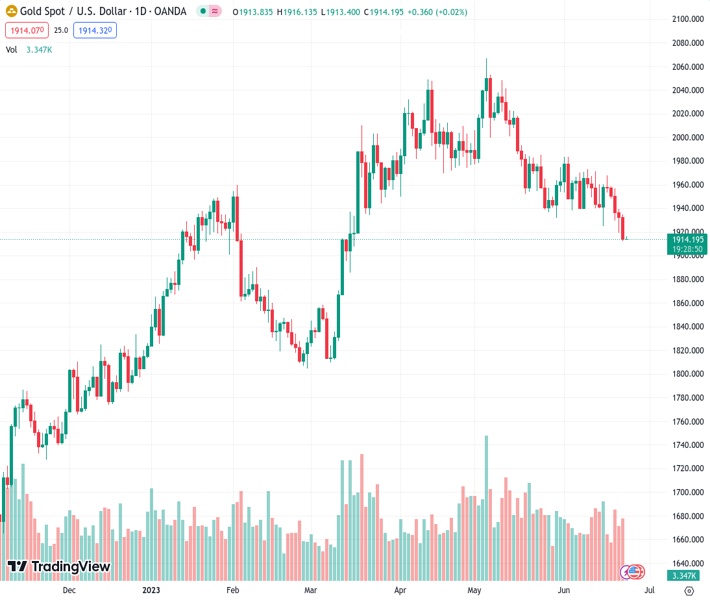
The price of gold, currently at 1,914.59 for the XAUUSD pair, is in a phase of consolidation following its recent decline, which has taken it to its lowest level in over three months.
…
This is a premium post.
[s2If !current_user_can(access_s2member_level4)]Please register for FREE REGISTER to read full post below containing analysis. In case of any error or you think you are not able to read the full post below, please email us at support#nehcap.com [lwa][/s2If] [s2If current_user_can(access_s2member_level1)]
- Gold price is seen consolidating its recent downfall to over a three-month low.
The pair currently trades last at 1914.59.
The previous day high was 1935.06 while the previous day low was 1912.46. The daily 38.2% Fib levels comes at 1921.09, expected to provide resistance. Similarly, the daily 61.8% fib level is at 1926.43, expected to provide resistance.
Gold price enters a bearish consolidation phase during the Asian session on Friday and oscillates in a narrow trading band near the $1,915-$1,916 area, just above its lowest level since March 16 touched the previous day.
A slew of interest rate hikes and a more hawkish outlook by major central banks turn out to be a key factor that continues to act as a headwind for the non-yielding Gold price. In fact, the Bank of England (BoE), the Swiss National Bank (SNB) and Norges Bank all hiked their benchmark interest rates on Thursday. This comes on the back of a surprise 25 basis points (bps) rate hike by the Reserve Bank of Australia (RBA) and the Bank of Canada (BoC) earlier this month. Moreover, the European Central Bank (ECB) last week lifted rates to the highest level in 22 years and projected further tightening to bring down inflation.
Furthermore, Federal Reserve (Fed) Chair Jerome Powell, during his two-day congressional testimony, reiterated that the central bank will likely raise interest rates again this year, albeit at a “careful pace”, to combat stubbornly high inflation. Powell added that the Fed doesn’t see rate cuts happening any time soon and is going to wait until it is confident that inflation is moving down to the 2% target. This, in turn, led to the overnight sharp rise in the US Treasury bond yields, which is seen offering some support to the US Dollar (USD) and might further contribute to keeping a lid on the US Dollar-denominated Gold price.
Investors, meanwhile, now seem worried about economic headwinds stemming from rapidly rising borrowing costs. This is evident from the prevalent cautious mood around the equity markets and helps limit the downside for the safe-haven precious metal, at least for the time being. The upside potential, however, seems limited, warranting some caution for aggressive traders and before positioning for any meaningful recovery. Nevertheless, the Gold price remains on track to register heavy weekly losses and seems poised to extend its recent pullback from the all-time high, around the $2,080 region touched in May.
Market participants now look forward to the release of the flash Purchasing Managers’ Index (PMI) from the Eurozone, the United Kingdom (UK) and the United States (USD). The data will provide fresh cues about the global economic condition and drive demand for traditional safe-haven assets, including the XAU/USD. Apart from this, the US bond yields will influence the USD price dynamics and contribute to producing short-term trading opportunities around Gold price on the last day of the week.
From a technical perspective, this week’s sustained break and acceptance below the 100-day Simple Moving Average (SMA) was seen as a fresh trigger for bearish traders. Moreover, oscillators on the daily chart are holding deep in the bearish territory and are still far from being in the oversold zone. This suggests that the path of least resistance for the Gold price is to the downside and supports prospects for further losses. Hence, a subsequent slide towards the $1,900 mark, en route to the $1,876-$1,875 area and the very important 200-day SMA around the $1,840 region, looks like a distinct possibility.
On the flip side, the $1,924-$1,925 zone now seems to act as an immediate hurdle ahead of the $1,936 area and the 100-day SMA, currently around the $1,942 region. Any subsequent move beyond might continue to attract fresh supply and remain capped near the $1,962-$1,964 region. This is closely followed by resistance near the $1,970-$1,972 zone and the $1,983-$1,985 region. A sustained strength beyond the said barriers might trigger a fresh bout of a short-covering move, allowing the Gold price to surpass the $2,000 psychological mark and climb further towards the $2,010-$2,012 resistance.
Technical Levels: Supports and Resistances
XAUUSD currently trading at 1914.96 at the time of writing. Pair opened at 1913.88 and is trading with a change of 0.06 % .
| Overview | Overview.1 | |
|---|---|---|
| 0 | Today last price | 1914.96 |
| 1 | Today Daily Change | 1.08 |
| 2 | Today Daily Change % | 0.06 |
| 3 | Today daily open | 1913.88 |
The pair is trading below its 20 Daily moving average @ 1951.15, below its 50 Daily moving average @ 1978.98 , below its 100 Daily moving average @ 1942.1 and above its 200 Daily moving average @ 1852.09
| Trends | Trends.1 | |
|---|---|---|
| 0 | Daily SMA20 | 1951.15 |
| 1 | Daily SMA50 | 1978.98 |
| 2 | Daily SMA100 | 1942.10 |
| 3 | Daily SMA200 | 1852.09 |
The previous day high was 1935.06 while the previous day low was 1912.46. The daily 38.2% Fib levels comes at 1921.09, expected to provide resistance. Similarly, the daily 61.8% fib level is at 1926.43, expected to provide resistance.
Note the levels of interest below:
- Pivot support is noted at 1905.87, 1897.87, 1883.27
- Pivot resistance is noted at 1928.47, 1943.07, 1951.07
| Levels | Levels.1 |
|---|---|
| Previous Daily High | 1935.06 |
| Previous Daily Low | 1912.46 |
| Previous Weekly High | 1971.01 |
| Previous Weekly Low | 1924.85 |
| Previous Monthly High | 2079.76 |
| Previous Monthly Low | 1932.12 |
| Daily Fibonacci 38.2% | 1921.09 |
| Daily Fibonacci 61.8% | 1926.43 |
| Daily Pivot Point S1 | 1905.87 |
| Daily Pivot Point S2 | 1897.87 |
| Daily Pivot Point S3 | 1883.27 |
| Daily Pivot Point R1 | 1928.47 |
| Daily Pivot Point R2 | 1943.07 |
| Daily Pivot Point R3 | 1951.07 |
[/s2If]
Nehcap Expert Advisor
The NEHCAP MT4 EA is high quality professional trading system geared to generate returns without using GRID or martingales. Each trade has strict risk per trade parameter. The pairs under management include EURUSD, GBPUSD, AUDCAD, AUDNZD,GBPAUD, EURAUD, EURCAD, CHFJPY and many more.
The system is trading live: LIVE ACCOUNT TRACKING
You can run it free. Apply for a free trial and track our account. Buy the system or use profit share mechanism to generate returns on your MT4.
Join Our Telegram Group
")


