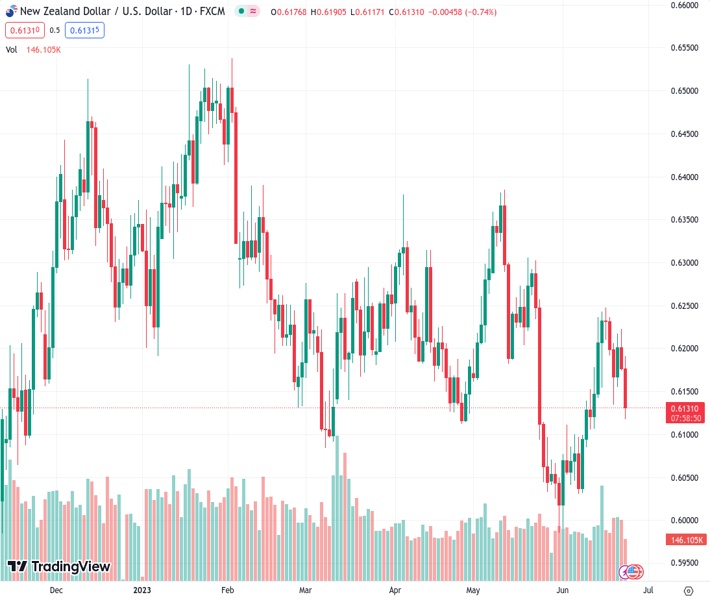
The NZDUSD currency pair dropped sharply to approximately 0.6130 in a risk-averse market environment.
…
This is a premium post.
[s2If !current_user_can(access_s2member_level4)]Please register for FREE REGISTER to read full post below containing analysis. In case of any error or you think you are not able to read the full post below, please email us at support#nehcap.com [lwa][/s2If] [s2If current_user_can(access_s2member_level1)]
- NZD/USD has displayed a perpendicular decline to near 0.6130 amid a risk-off mood.
The pair currently trades last at 0.61282.
The previous day high was 0.6224 while the previous day low was 0.6173. The daily 38.2% Fib levels comes at 0.6192, expected to provide resistance. Similarly, the daily 61.8% fib level is at 0.6205, expected to provide resistance.
The NZD/USD pair has posted a vertical fall to near 0.6130 in the early New York session. The Kiwi asset has delivered a bumpy ride amid headwinds of negative market sentiment due to accelerating fears of global recession.
S&P500 futures have extended their downside journey as investors are getting cautionary ahead of the second-quarter result season. The major focus will be on the banking, manufacturing, and technology sector as tight credit conditions by financial institutions might have weighed on their margins, manufacturing activities have been contracting straight for the past seven months, and tech-savvy companies have been reporting weak guidance.
The US Dollar Index (DXY) has corrected further to near 102.80, however, the downside bias has not faded yet. While US Treasury yields have shown a massive decline. The yields offered by 10-year US Treasury bonds have dropped to near 3.74%.
Meanwhile, Federal Reserve (Fed) policymakers are consistently favoring more interest rate hikes ahead. Current inflation is still twice the required rate of 2%. Following the footprints of Fed chair Jerome Powell, Fed Governor Michelle Bowman also felt that at least two more hikes are warranted.
In the American session, the preliminary US S&P PMI (June) will remain in focus. Investors will keenly watch Manufacturing PMI figures as the mentioned sector is consistently reporting contraction from the past seven months. Investors should note that a figure below 50.0 is considered a contraction in an activity.
On the Kiwi front, sheer monetary stimulus by the People’s Bank of China (PBoC) is failing to provide some strength to the New Zealand Dollar. To uplift China’s economic prospects, the PBoC is consistently favoring a dovish policy.
It is worth noting that New Zealand is one of the leading trading partners of China and expansionary PBoC policy supports the New Zealand Dollar.
Technical Levels: Supports and Resistances
NZDUSD currently trading at 0.6122 at the time of writing. Pair opened at 0.6178 and is trading with a change of -0.91 % .
| Overview | Overview.1 | |
|---|---|---|
| 0 | Today last price | 0.6122 |
| 1 | Today Daily Change | -0.0056 |
| 2 | Today Daily Change % | -0.9100 |
| 3 | Today daily open | 0.6178 |
The pair is trading above its 20 Daily moving average @ 0.612, below its 50 Daily moving average @ 0.6175 , below its 100 Daily moving average @ 0.6207 and below its 200 Daily moving average @ 0.6155
| Trends | Trends.1 | |
|---|---|---|
| 0 | Daily SMA20 | 0.6120 |
| 1 | Daily SMA50 | 0.6175 |
| 2 | Daily SMA100 | 0.6207 |
| 3 | Daily SMA200 | 0.6155 |
The previous day high was 0.6224 while the previous day low was 0.6173. The daily 38.2% Fib levels comes at 0.6192, expected to provide resistance. Similarly, the daily 61.8% fib level is at 0.6205, expected to provide resistance.
Note the levels of interest below:
- Pivot support is noted at 0.6159, 0.6141, 0.6108
- Pivot resistance is noted at 0.621, 0.6243, 0.6261
| Levels | Levels.1 |
|---|---|
| Previous Daily High | 0.6224 |
| Previous Daily Low | 0.6173 |
| Previous Weekly High | 0.6250 |
| Previous Weekly Low | 0.6076 |
| Previous Monthly High | 0.6385 |
| Previous Monthly Low | 0.5985 |
| Daily Fibonacci 38.2% | 0.6192 |
| Daily Fibonacci 61.8% | 0.6205 |
| Daily Pivot Point S1 | 0.6159 |
| Daily Pivot Point S2 | 0.6141 |
| Daily Pivot Point S3 | 0.6108 |
| Daily Pivot Point R1 | 0.6210 |
| Daily Pivot Point R2 | 0.6243 |
| Daily Pivot Point R3 | 0.6261 |
[/s2If]
Nehcap Expert Advisor
The NEHCAP MT4 EA is high quality professional trading system geared to generate returns without using GRID or martingales. Each trade has strict risk per trade parameter. The pairs under management include EURUSD, GBPUSD, AUDCAD, AUDNZD,GBPAUD, EURAUD, EURCAD, CHFJPY and many more.
The system is trading live: LIVE ACCOUNT TRACKING
You can run it free. Apply for a free trial and track our account. Buy the system or use profit share mechanism to generate returns on your MT4.
Join Our Telegram Group
")


