The EURUSD pair at 1.09528 is finding it difficult to continue the decline from yesterday’s seven-week high and has been inactive. According to @nehcap, there will only be a modest improvement.
…
This is a premium post.
[s2If !current_user_can(access_s2member_level4)]Please register for FREE REGISTER to read full post below containing analysis. In case of any error or you think you are not able to read the full post below, please email us at support#nehcap.com [lwa][/s2If] [s2If current_user_can(access_s2member_level1)]
- EUR/USD struggles to extend the previous day’s pullback from seven-week high, sidelined of late.
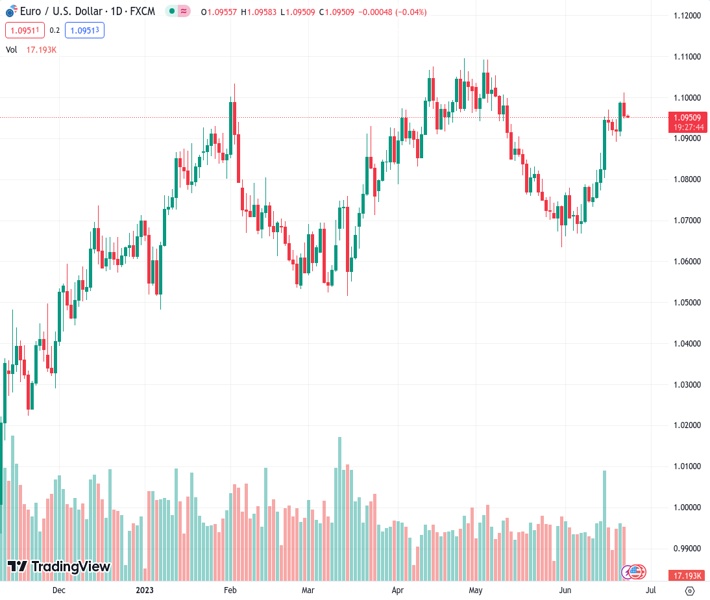
The pair currently trades last at 1.09528.
The previous day high was 1.1012 while the previous day low was 1.0949. The daily 38.2% Fib levels comes at 1.0973, expected to provide resistance. Similarly, the daily 61.8% fib level is at 1.0988, expected to provide resistance.
EUR/USD licks its wounds around mid-1.0900s after falling the most in two weeks as market players await the preliminary readings of June activity data from Germany, the Eurozone and the US on early Friday. In doing so, the Euro pair also portrays a struggle amid mixed technical catalysts.
Also read: EUR/USD pullback jostles with 1.0950 as central banks, Fed Powell propel US Dollar, PMI in focus
That said, the 100-SMA pierces the 200-SMA from below and depicts the “Bull cross” on the four-hour chart. The same joins the comparatively more hawkish bias of the European Central Bank (ECB) Officials versus the Federal Reserve’s (Fed) pause of the rate hike trajectory to challenge the Euro bears of late.
However, a rising wedge bearish chart formation and downbeat MACD signals join the Euro pair’s U-turn from the six-week-old horizontal resistance area, around 1.1000-1.1005, to tame the bullish bias surrounding the EUR/USD pair.
Hence, the quote’s latest inaction remains elusive unless it either confirms the rising wedge by breaking the 1.0940 support or crosses the last Friday’s peak of 1.0970.
It should be noted that the rising wedge confirmation will need validation from the aforementioned SMA confluence surrounding 1.0815-10 and an ascending support line from May 31, close to 1.0770 by the press time.
On the contrary, an upside break of the 1.0970 and 1.1005 immediate hurdles will allow the EUR/USD bulls to challenge the rising wedge bearish chart formation by poking the stated pattern’s top line of around 1.1060.
Trend: Limited recovery expected
Technical Levels: Supports and Resistances
EURUSD currently trading at 1.0955 at the time of writing. Pair opened at 1.0956 and is trading with a change of -0.01% % .
| Overview | Overview.1 | |
|---|---|---|
| 0 | Today last price | 1.0955 |
| 1 | Today Daily Change | -0.0001 |
| 2 | Today Daily Change % | -0.01% |
| 3 | Today daily open | 1.0956 |
The pair remains strongly bullish on the daily timeframe. It trades above its 20 SMA @ 1.08, 50 SMA 1.0878, 100 SMA @ 1.0808 and 200 SMA @ 1.0561.
| Trends | Trends.1 | |
|---|---|---|
| 0 | Daily SMA20 | 1.0800 |
| 1 | Daily SMA50 | 1.0878 |
| 2 | Daily SMA100 | 1.0808 |
| 3 | Daily SMA200 | 1.0561 |
The previous day high was 1.1012 while the previous day low was 1.0949. The daily 38.2% Fib levels comes at 1.0973, expected to provide resistance. Similarly, the daily 61.8% fib level is at 1.0988, expected to provide resistance.
Note the levels of interest below:
- Pivot support is noted at 1.0932, 1.0909, 1.0869
- Pivot resistance is noted at 1.0996, 1.1036, 1.1059
| Levels | Levels.1 |
|---|---|
| Previous Daily High | 1.1012 |
| Previous Daily Low | 1.0949 |
| Previous Weekly High | 1.0971 |
| Previous Weekly Low | 1.0733 |
| Previous Monthly High | 1.1092 |
| Previous Monthly Low | 1.0635 |
| Daily Fibonacci 38.2% | 1.0973 |
| Daily Fibonacci 61.8% | 1.0988 |
| Daily Pivot Point S1 | 1.0932 |
| Daily Pivot Point S2 | 1.0909 |
| Daily Pivot Point S3 | 1.0869 |
| Daily Pivot Point R1 | 1.0996 |
| Daily Pivot Point R2 | 1.1036 |
| Daily Pivot Point R3 | 1.1059 |
[/s2If]
Nehcap Expert Advisor
The NEHCAP MT4 EA is high quality professional trading system geared to generate returns without using GRID or martingales. Each trade has strict risk per trade parameter. The pairs under management include EURUSD, GBPUSD, AUDCAD, AUDNZD,GBPAUD, EURAUD, EURCAD, CHFJPY and many more.
The system is trading live: LIVE ACCOUNT TRACKING
You can run it free. Apply for a free trial and track our account. Buy the system or use profit share mechanism to generate returns on your MT4.
Join Our Telegram Group
")


