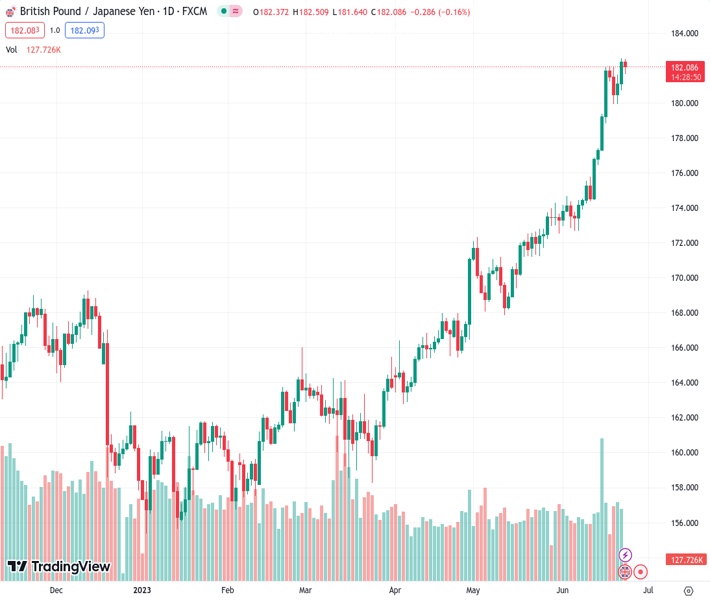
The currency pair GBPJPY, currently trading at 182.106, has attracted buying interest to reduce its earlier losses and approach its highest point in several months.
…
This is a premium post.
[s2If !current_user_can(access_s2member_level4)]Please register for FREE REGISTER to read full post below containing analysis. In case of any error or you think you are not able to read the full post below, please email us at support#nehcap.com [lwa][/s2If] [s2If current_user_can(access_s2member_level1)]
- GBP/JPY picks up bids to pare intraday loss near the multi-month high.
The pair currently trades last at 182.106.
The previous day high was 182.56 while the previous day low was 180.72. The daily 38.2% Fib levels comes at 181.86, expected to provide support. Similarly, the daily 61.8% fib level is at 181.42, expected to provide support.
GBP/JPY consolidates intraday losses around the highest levels since December 2015 on upbeat UK Retail Sales numbers published early Friday morning in London. In doing so, the cross-currency pair also justifies downbeat Japan activity data amid the risk-off mood.
UK Retail Sales marks 0.3% monthly growth in May compared to 0.2% expected contraction and 0.5% previous increase. That said, the Retail Sales ex-Fuel numbers also rose past -0.3% market forecasts to 0.1% while staying below 0.7% prior readings.
That said, the preliminary readings of Japan’s Jibun Bank Manufacturing PMI for June dropped to 49.8 versus 50.7 expected and 50.6 prior. On the same line, the first estimations of the Asian major’s Jibun Bank Services PMI drops to 54.2 during the stated month, from 55.9 expected and 56.9 previous readings.
Earlier in the day, the BoE-induced recession woes prod the GBP/JPY bulls. The consolidation move also took clues from the mixed Japanese inflation numbers. That said, Japan’s National Consumer Price Index (CPI) eased to 3.2% YoY in May from 4.1% market forecasts and 3.5% prior whereas the National CPI ex Food, Energy, rose past 4.1% previous readings to 4.3% but lagged behind the 4.4% prior.
It’s worth noting that the Bank of Japan’s (BoJ) Japanese Government Bond (BoJ) issues also weighed on the GBP/JPY price as Tokyo opened.
That said, the Bank of England (BoE), informally known as the “Old Lady”, surprised markets by lifting benchmark rates by 50 basis points (bps) to 5% versus major expectations favoring a 0.25% rate hike on Thursday. The same joined the BoJ’s dovish bias to propel the GBP/JPY price. However, the OIS pricing of the BoE peak rate suggests a sooner end to the tightening cycle than expected, which in turn prods the pair buyers afterward. Additionally, the bumper rate hike also signals the economic toll amid the chatters of the British recession, which in turn challenges the bulls despite heavy rate hikes.
Looking ahead, the preliminary readings of the UK’s S&P Global/CIPS PMIs for June will be important to watch as the market’s fears of British recession challenge the cross-currency pair’s further upside at the multi-month high.
Unless breaking the eight-day-old ascending support line, around 181.50 by the press time, not even intraday sellers of the GBP/JPY can take the chance of entering the short positions.
Technical Levels: Supports and Resistances
GBPJPY currently trading at 182.06 at the time of writing. Pair opened at 182.44 and is trading with a change of -0.21% % .
| Overview | Overview.1 | |
|---|---|---|
| 0 | Today last price | 182.06 |
| 1 | Today Daily Change | -0.38 |
| 2 | Today Daily Change % | -0.21% |
| 3 | Today daily open | 182.44 |
The pair remains strongly bullish on the daily timeframe. It trades above its 20 SMA @ 176.46, 50 SMA 172.26, 100 SMA @ 167.28 and 200 SMA @ 165.44.
| Trends | Trends.1 | |
|---|---|---|
| 0 | Daily SMA20 | 176.46 |
| 1 | Daily SMA50 | 172.26 |
| 2 | Daily SMA100 | 167.28 |
| 3 | Daily SMA200 | 165.44 |
The previous day high was 182.56 while the previous day low was 180.72. The daily 38.2% Fib levels comes at 181.86, expected to provide support. Similarly, the daily 61.8% fib level is at 181.42, expected to provide support.
Note the levels of interest below:
- Pivot support is noted at 181.25, 180.06, 179.4
- Pivot resistance is noted at 183.09, 183.75, 184.94
| Levels | Levels.1 |
|---|---|
| Previous Daily High | 182.56 |
| Previous Daily Low | 180.72 |
| Previous Weekly High | 182.04 |
| Previous Weekly Low | 174.36 |
| Previous Monthly High | 174.28 |
| Previous Monthly Low | 167.84 |
| Daily Fibonacci 38.2% | 181.86 |
| Daily Fibonacci 61.8% | 181.42 |
| Daily Pivot Point S1 | 181.25 |
| Daily Pivot Point S2 | 180.06 |
| Daily Pivot Point S3 | 179.40 |
| Daily Pivot Point R1 | 183.09 |
| Daily Pivot Point R2 | 183.75 |
| Daily Pivot Point R3 | 184.94 |
[/s2If]
Nehcap Expert Advisor
The NEHCAP MT4 EA is high quality professional trading system geared to generate returns without using GRID or martingales. Each trade has strict risk per trade parameter. The pairs under management include EURUSD, GBPUSD, AUDCAD, AUDNZD,GBPAUD, EURAUD, EURCAD, CHFJPY and many more.
The system is trading live: LIVE ACCOUNT TRACKING
You can run it free. Apply for a free trial and track our account. Buy the system or use profit share mechanism to generate returns on your MT4.
Join Our Telegram Group
")


