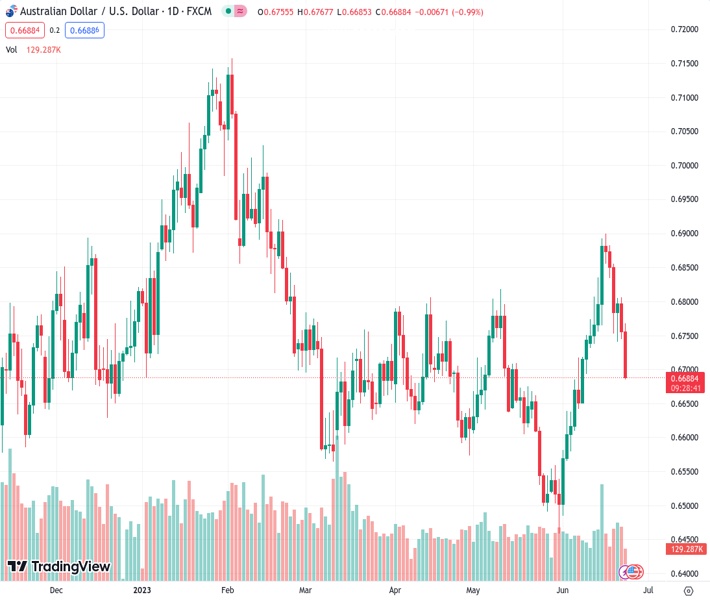
The AUDUSD pair, currently trading at 0.66873, has attempted to breach the level below 0.6700 due to a negative perception of the risk factors.
…
This is a premium post.
[s2If !current_user_can(access_s2member_level4)]Please register for FREE REGISTER to read full post below containing analysis. In case of any error or you think you are not able to read the full post below, please email us at support#nehcap.com [lwa][/s2If] [s2If current_user_can(access_s2member_level1)]
- AUD/USD has tested region below 0.6700 as the risk profile remains downbeat.
The pair currently trades last at 0.66873.
The previous day high was 0.6806 while the previous day low was 0.6745. The daily 38.2% Fib levels comes at 0.6768, expected to provide resistance. Similarly, the daily 61.8% fib level is at 0.6783, expected to provide resistance.
The AUD/USD pair has tested territory below the round-level support of 0.6700 for the first time in the past ten trading sessions. The Aussie asset has faced immense pressure as the market mood has turned quite risk-off due to fears of the global recession.
The US Dollar Index (DXY) is on the seventh cloud amid a risk-aversion theme. The USD Index has refreshed its weekly high at 103.17 as the Federal Reserve (Fed) is expected to raise interest rates further to achieve price stability.
Meanwhile, upbeat preliminary S&P PMI numbers have failed to support the Australian Dollar. Manufacturing PMI landed at 48.6, higher than the expectations of 48.1 and the former release of 48.4. Also, Services PMI at 50.7 outperformed expectations of 50.1 but remained lower than the former release of 52.1.
AUD/USD has dropped to near the 50% Fibonacci retracement (plotted from May 31 low at 0.6458 to June 16 high at 0.6900) at 0.6680 on a two-hour scale. Downward-sloping 20-period Exponential Moving Average (EMA) at 0.6743 indicates that the selling pressure is on Australian Dollar bulls.
The Relative Strength Index (RSI) (14) has shifted into the bearish range of 20.00-60.00 from the bullish range in which the momentum oscillator would face selling pressure after a pullback to 60.00.
A decisive break below the 50% Fibo retracement at 0.6680 would expose the asset to 61.8% Fibo retracement at 0.6628 followed by June 05 low at 0.6579.
On the flip side, a confident break above the round-level resistance of 0.6800 would expose the asset to June 20 high at 0.6855. A break above the latter would drive the asset toward June 16 high at 0.6900.
Technical Levels: Supports and Resistances
AUDUSD currently trading at 0.6688 at the time of writing. Pair opened at 0.6756 and is trading with a change of -1.01 % .
| Overview | Overview.1 | |
|---|---|---|
| 0 | Today last price | 0.6688 |
| 1 | Today Daily Change | -0.0068 |
| 2 | Today Daily Change % | -1.0100 |
| 3 | Today daily open | 0.6756 |
The pair is trading below its 20 Daily moving average @ 0.6696, above its 50 Daily moving average @ 0.6681 , below its 100 Daily moving average @ 0.6716 and below its 200 Daily moving average @ 0.6692
| Trends | Trends.1 | |
|---|---|---|
| 0 | Daily SMA20 | 0.6696 |
| 1 | Daily SMA50 | 0.6681 |
| 2 | Daily SMA100 | 0.6716 |
| 3 | Daily SMA200 | 0.6692 |
The previous day high was 0.6806 while the previous day low was 0.6745. The daily 38.2% Fib levels comes at 0.6768, expected to provide resistance. Similarly, the daily 61.8% fib level is at 0.6783, expected to provide resistance.
Note the levels of interest below:
- Pivot support is noted at 0.6732, 0.6708, 0.667
- Pivot resistance is noted at 0.6793, 0.683, 0.6855
| Levels | Levels.1 |
|---|---|
| Previous Daily High | 0.6806 |
| Previous Daily Low | 0.6745 |
| Previous Weekly High | 0.6900 |
| Previous Weekly Low | 0.6732 |
| Previous Monthly High | 0.6818 |
| Previous Monthly Low | 0.6458 |
| Daily Fibonacci 38.2% | 0.6768 |
| Daily Fibonacci 61.8% | 0.6783 |
| Daily Pivot Point S1 | 0.6732 |
| Daily Pivot Point S2 | 0.6708 |
| Daily Pivot Point S3 | 0.6670 |
| Daily Pivot Point R1 | 0.6793 |
| Daily Pivot Point R2 | 0.6830 |
| Daily Pivot Point R3 | 0.6855 |
[/s2If]
Nehcap Expert Advisor
The NEHCAP MT4 EA is high quality professional trading system geared to generate returns without using GRID or martingales. Each trade has strict risk per trade parameter. The pairs under management include EURUSD, GBPUSD, AUDCAD, AUDNZD,GBPAUD, EURAUD, EURCAD, CHFJPY and many more.
The system is trading live: LIVE ACCOUNT TRACKING
You can run it free. Apply for a free trial and track our account. Buy the system or use profit share mechanism to generate returns on your MT4.
Join Our Telegram Group
")


