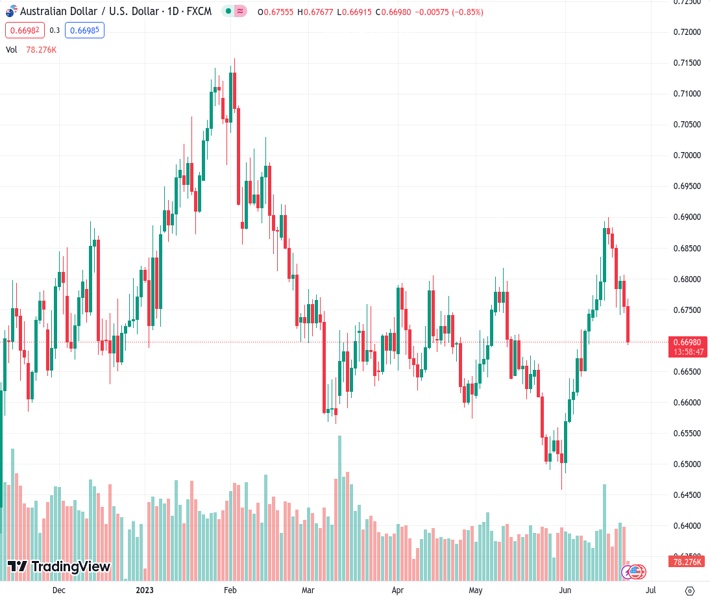
The AUDUSD currency pair, currently at 0.66983, is experiencing continued downward pressure and has reached its lowest levels in the past two weeks. This is confirmed by the breakdown of the 100-SMA and bearish MACD signals. However, there is anticipation that the downside for the currency pair will be restricted in the near future.
…
This is a premium post.
[s2If !current_user_can(access_s2member_level4)]Please register for FREE REGISTER to read full post below containing analysis. In case of any error or you think you are not able to read the full post below, please email us at support#nehcap.com [lwa][/s2If] [s2If current_user_can(access_s2member_level1)]
- AUD/USD remains pressured at the lowest levels in two weeks, justifies 100-SMA breakdown and bearish MACD signals.
The pair currently trades last at 0.66983.
The previous day high was 0.6806 while the previous day low was 0.6745. The daily 38.2% Fib levels comes at 0.6768, expected to provide resistance. Similarly, the daily 61.8% fib level is at 0.6783, expected to provide resistance.
AUD/USD bears are in the driver’s seat at the lowest level in a fortnight, down 0.90% intraday around 0.6700 by the press time.
In doing so, the risk-barometer pair aptly portrays the market’s risk-off mood, backed by fears of economic slowdown and hawkish Fed moves in July versus the Reserve Bank of Australia’s (RBA) limited horizontal for further rate hikes.
That said, the pair’s clear downside break of the 100-SMA and bearish MACD signals add strength to the downside bias.
However, the oversold RSI (14) line hints at the limited downside room for the Aussie pair, which in turn highlights a joint of the 200-SMA and 50% Fibonacci retracement of the quote’s May 31 to June 16 upside, near 0.6680-75.
It’s worth noting that the AUD/USD pair’s weakness past 0.6675 needs validation from the 61.8% Fibonacci retracement level of 0.6630 and the May 05 swing low of around 0.6580-75 to welcome the bears.
Meanwhile, a successful break of the 100-SMA, around 0.6735 by the press time, becomes necessary but not enough for the AUD/USD bulls to retake control.
The reason could be linked to the existence of seven-week-old and one-week-long horizontal resistances, around 0.6800 and 0.6840 in that order.
To sum up, AUD/USD is likely to remain bearish but the further downside appears difficult, suggesting a corrective bounce before the fresh leg towards the south.
Trend: Limited downside expected
Technical Levels: Supports and Resistances
AUDUSD currently trading at 0.6698 at the time of writing. Pair opened at 0.6756 and is trading with a change of -0.86% % .
| Overview | Overview.1 | |
|---|---|---|
| 0 | Today last price | 0.6698 |
| 1 | Today Daily Change | -0.0058 |
| 2 | Today Daily Change % | -0.86% |
| 3 | Today daily open | 0.6756 |
The pair is trading above its 20 Daily moving average @ 0.6696, above its 50 Daily moving average @ 0.6681 , below its 100 Daily moving average @ 0.6716 and above its 200 Daily moving average @ 0.6692
| Trends | Trends.1 | |
|---|---|---|
| 0 | Daily SMA20 | 0.6696 |
| 1 | Daily SMA50 | 0.6681 |
| 2 | Daily SMA100 | 0.6716 |
| 3 | Daily SMA200 | 0.6692 |
The previous day high was 0.6806 while the previous day low was 0.6745. The daily 38.2% Fib levels comes at 0.6768, expected to provide resistance. Similarly, the daily 61.8% fib level is at 0.6783, expected to provide resistance.
Note the levels of interest below:
- Pivot support is noted at 0.6732, 0.6708, 0.667
- Pivot resistance is noted at 0.6793, 0.683, 0.6855
| Levels | Levels.1 |
|---|---|
| Previous Daily High | 0.6806 |
| Previous Daily Low | 0.6745 |
| Previous Weekly High | 0.6900 |
| Previous Weekly Low | 0.6732 |
| Previous Monthly High | 0.6818 |
| Previous Monthly Low | 0.6458 |
| Daily Fibonacci 38.2% | 0.6768 |
| Daily Fibonacci 61.8% | 0.6783 |
| Daily Pivot Point S1 | 0.6732 |
| Daily Pivot Point S2 | 0.6708 |
| Daily Pivot Point S3 | 0.6670 |
| Daily Pivot Point R1 | 0.6793 |
| Daily Pivot Point R2 | 0.6830 |
| Daily Pivot Point R3 | 0.6855 |
[/s2If]
Nehcap Expert Advisor
The NEHCAP MT4 EA is high quality professional trading system geared to generate returns without using GRID or martingales. Each trade has strict risk per trade parameter. The pairs under management include EURUSD, GBPUSD, AUDCAD, AUDNZD,GBPAUD, EURAUD, EURCAD, CHFJPY and many more.
The system is trading live: LIVE ACCOUNT TRACKING
You can run it free. Apply for a free trial and track our account. Buy the system or use profit share mechanism to generate returns on your MT4.
Join Our Telegram Group
")


