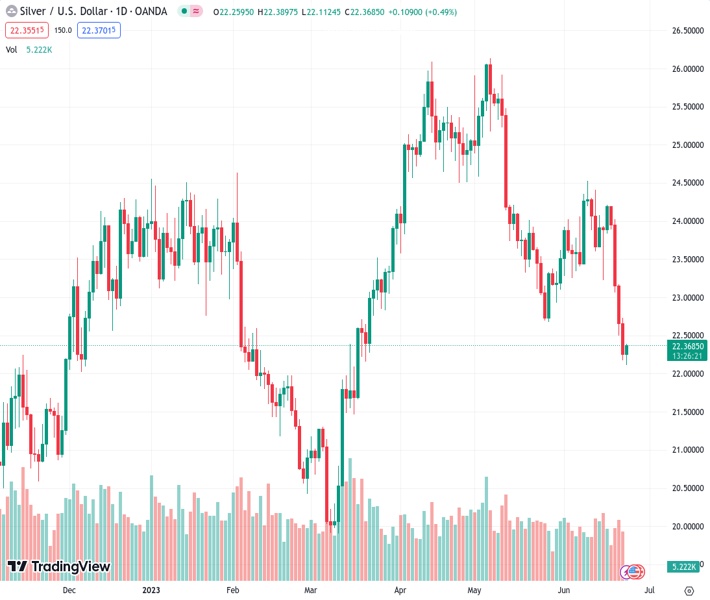
Silver rebounds from a recent low that it hit on Friday, but there is no evidence of any further purchasing activity. The price is currently at 22.331 for XAGUSD.
…
This is a premium post.
[s2If !current_user_can(access_s2member_level4)]Please register for FREE REGISTER to read full post below containing analysis. In case of any error or you think you are not able to read the full post below, please email us at support#nehcap.com [lwa][/s2If] [s2If current_user_can(access_s2member_level1)]
- Silver bounces off a multi-month low touched on Friday, albeit lacks any follow-through buying.
The pair currently trades last at 22.331.
The previous day high was 22.74 while the previous day low was 22.18. The daily 38.2% Fib levels comes at 22.39, expected to provide resistance. Similarly, the daily 61.8% fib level is at 22.52, expected to provide resistance.
Silver stages a modest bounce from the vicinity of the $22.00 round-figure mark, or over a three-month low touched this Friday and for now, seems to have snapped a four-day losing streak. Spot prices, however, lack follow-through buying and trade below the mid-$22.00s, around the 61.8% Fibonacci retracement level of the March-May rally heading into the European session.
From a technical perspective, the overnight break and acceptance below the very important 200-day Simple Moving Average (SMA) was seen as a fresh trigger for bearish traders, against the backdrop of the recent failure near the 50-day SMA. Moreover, oscillators on the daily chart are holding deep in the negative territory and are still far from being in the oversold zone. This, in turn, adds credence to the bearish outlook for the XAG/USD and supports prospects for a further depreciating move.
Some follow-through selling below the $22.10 area, or the monthly low, will reaffirm the negative bias and drag the XAG/USD towards the $21.70-$21.65 support zone. The downward trajectory could get extended further towards the $21.25 intermediate support en route to the $21.00 round figure. The next relevant support is pegged near the $20.50 area, below which bears might eventually aim towards challenging the YTD low, levels just below the $20.00 psychological mark touched in March.
On the flip side, any meaningful recovery beyond the $23.45 area (200-day SMA) is more likely to attract fresh sellers near the $23.70 zone and remain capped near the $23.00 round-figure mark. The said handle coincides with the 50% Fibo. level, which if cleared decisively might trigger a short-covering rally and lift the XAG/USD to the $23.30-$23.35 hurdle en route to 38.2% Fibo. level, around the $23.70-$23.75 zone. The latter should now act as a pivotal point for short-term traders.
Technical Levels: Supports and Resistances
XAGUSD currently trading at 22.27 at the time of writing. Pair opened at 22.25 and is trading with a change of 0.09 % .
| Overview | Overview.1 | |
|---|---|---|
| 0 | Today last price | 22.27 |
| 1 | Today Daily Change | 0.02 |
| 2 | Today Daily Change % | 0.09 |
| 3 | Today daily open | 22.25 |
The pair remains strongly bearish on the daily time frame. It trades below the 20 SMA @ 23.58, 50 SMA 24.25, 100 SMA @ 23.33 and 200 SMA @ 22.47.
| Trends | Trends.1 | |
|---|---|---|
| 0 | Daily SMA20 | 23.58 |
| 1 | Daily SMA50 | 24.25 |
| 2 | Daily SMA100 | 23.33 |
| 3 | Daily SMA200 | 22.47 |
The previous day high was 22.74 while the previous day low was 22.18. The daily 38.2% Fib levels comes at 22.39, expected to provide resistance. Similarly, the daily 61.8% fib level is at 22.52, expected to provide resistance.
Note the levels of interest below:
- Pivot support is noted at 22.04, 21.83, 21.49
- Pivot resistance is noted at 22.6, 22.94, 23.15
| Levels | Levels.1 |
|---|---|
| Previous Daily High | 22.74 |
| Previous Daily Low | 22.18 |
| Previous Weekly High | 24.40 |
| Previous Weekly Low | 23.22 |
| Previous Monthly High | 26.14 |
| Previous Monthly Low | 22.68 |
| Daily Fibonacci 38.2% | 22.39 |
| Daily Fibonacci 61.8% | 22.52 |
| Daily Pivot Point S1 | 22.04 |
| Daily Pivot Point S2 | 21.83 |
| Daily Pivot Point S3 | 21.49 |
| Daily Pivot Point R1 | 22.60 |
| Daily Pivot Point R2 | 22.94 |
| Daily Pivot Point R3 | 23.15 |
[/s2If]
Nehcap Expert Advisor
The NEHCAP MT4 EA is high quality professional trading system geared to generate returns without using GRID or martingales. Each trade has strict risk per trade parameter. The pairs under management include EURUSD, GBPUSD, AUDCAD, AUDNZD,GBPAUD, EURAUD, EURCAD, CHFJPY and many more.
The system is trading live: LIVE ACCOUNT TRACKING
You can run it free. Apply for a free trial and track our account. Buy the system or use profit share mechanism to generate returns on your MT4.
Join Our Telegram Group
")


