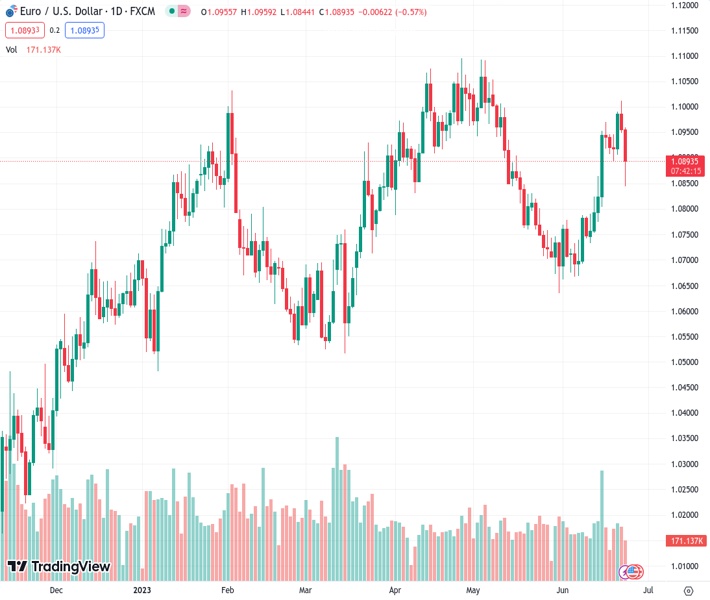
On Friday, the EURUSD pair experienced a significant decline, falling to the range of 1.0845/40 from its initial position at 1.08925.
…
This is a premium post.
[s2If !current_user_can(access_s2member_level4)]Please register for FREE REGISTER to read full post below containing analysis. In case of any error or you think you are not able to read the full post below, please email us at support#nehcap.com [lwa][/s2If] [s2If current_user_can(access_s2member_level1)]
- EUR/USD drops heavily to the 1.0845/40 band on Friday.
The pair currently trades last at 1.08925.
The previous day high was 1.1012 while the previous day low was 1.0949. The daily 38.2% Fib levels comes at 1.0973, expected to provide resistance. Similarly, the daily 61.8% fib level is at 1.0988, expected to provide resistance.
EUR/USD rapidly breaks below the 1.0900 support to clinch new multi-day lows in the vicinity of 1.0840 on Friday.
The inability of the pair to regain traction and surpass the June high at 1.1012 (June 22) should prompt sellers to regain control and trigger extra losses in the short-term horizon.
That said, the immediate contention emerges at the 100-day SMA at 1.0807, while the loss of this level could pave the way to another visit to the May low of 1.0635 (May 31).
Looking at the longer run, the positive view remains unchanged while above the 200-day SMA, today at 1.0563
Technical Levels: Supports and Resistances
EURUSD currently trading at 1.0887 at the time of writing. Pair opened at 1.0956 and is trading with a change of -0.63 % .
| Overview | Overview.1 | |
|---|---|---|
| 0 | Today last price | 1.0887 |
| 1 | Today Daily Change | 115.0000 |
| 2 | Today Daily Change % | -0.6300 |
| 3 | Today daily open | 1.0956 |
The pair remains strongly bullish on the daily timeframe. It trades above its 20 SMA @ 1.08, 50 SMA 1.0878, 100 SMA @ 1.0808 and 200 SMA @ 1.0561.
| Trends | Trends.1 | |
|---|---|---|
| 0 | Daily SMA20 | 1.0800 |
| 1 | Daily SMA50 | 1.0878 |
| 2 | Daily SMA100 | 1.0808 |
| 3 | Daily SMA200 | 1.0561 |
The previous day high was 1.1012 while the previous day low was 1.0949. The daily 38.2% Fib levels comes at 1.0973, expected to provide resistance. Similarly, the daily 61.8% fib level is at 1.0988, expected to provide resistance.
Note the levels of interest below:
- Pivot support is noted at 1.0932, 1.0909, 1.0869
- Pivot resistance is noted at 1.0996, 1.1036, 1.1059
| Levels | Levels.1 |
|---|---|
| Previous Daily High | 1.1012 |
| Previous Daily Low | 1.0949 |
| Previous Weekly High | 1.0971 |
| Previous Weekly Low | 1.0733 |
| Previous Monthly High | 1.1092 |
| Previous Monthly Low | 1.0635 |
| Daily Fibonacci 38.2% | 1.0973 |
| Daily Fibonacci 61.8% | 1.0988 |
| Daily Pivot Point S1 | 1.0932 |
| Daily Pivot Point S2 | 1.0909 |
| Daily Pivot Point S3 | 1.0869 |
| Daily Pivot Point R1 | 1.0996 |
| Daily Pivot Point R2 | 1.1036 |
| Daily Pivot Point R3 | 1.1059 |
[/s2If]
Nehcap Expert Advisor
The NEHCAP MT4 EA is high quality professional trading system geared to generate returns without using GRID or martingales. Each trade has strict risk per trade parameter. The pairs under management include EURUSD, GBPUSD, AUDCAD, AUDNZD,GBPAUD, EURAUD, EURCAD, CHFJPY and many more.
The system is trading live: LIVE ACCOUNT TRACKING
You can run it free. Apply for a free trial and track our account. Buy the system or use profit share mechanism to generate returns on your MT4.
Join Our Telegram Group
")


