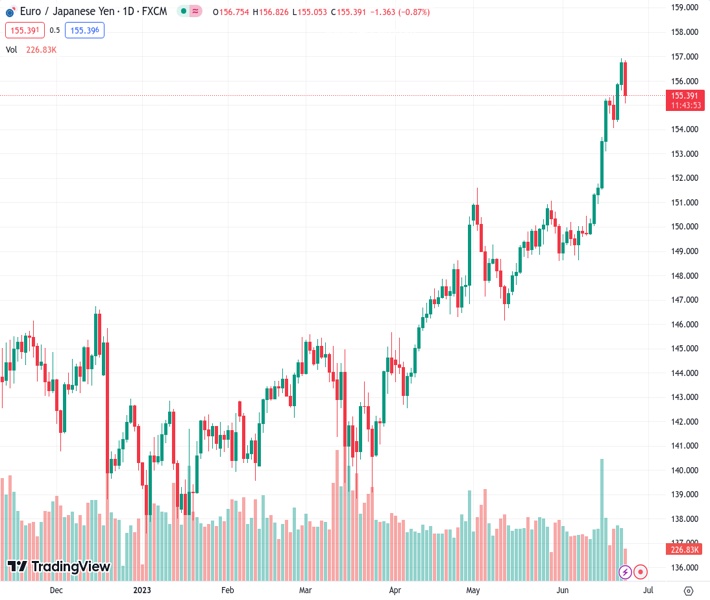
On Friday, EURJPY at 155.411 encountered significant resistance and experienced a significant decrease from its multi-year high level.
…
This is a premium post.
[s2If !current_user_can(access_s2member_level4)]Please register for FREE REGISTER to read full post below containing analysis. In case of any error or you think you are not able to read the full post below, please email us at support#nehcap.com [lwa][/s2If] [s2If current_user_can(access_s2member_level1)]
- EUR/JPY meets with heavy supply on Friday and corrects sharply from a multi-year top.
The pair currently trades last at 155.411.
The previous day high was 156.93 while the previous day low was 155.61. The daily 38.2% Fib levels comes at 156.43, expected to provide resistance. Similarly, the daily 61.8% fib level is at 156.12, expected to provide resistance.
The EUR/JPY cross comes under intense selling pressure on Friday and snaps a two-day winning streak to its highest level since September 2008, around the 157.00 neighbourhood touched the previous day. The intraday downward trajectory picks up pace during the early European session and drags spot prices to a fresh daily low, around the 155.00 psychological mark in the last hour.
The shared currency takes a hit following the rather disappointing release of Eurozone PMI prints, which, in turn, is seen as a key factor behind the latest leg of a sudden drop for the EUR/JPY cross. In fact, S&P Global’s preliminary report pointed to a sharp slowdown in business activity in France and Germany – the Eurozone’s two largest economies. This comes on the back of worries about economic headwinds stemming from rapidly rising borrowing costs, which, to a larger extent, offsets the European Central Bank’s hawkish outlook and does little to impress the Euro bulls.
The Japanese Yen (JPY), on the other hand, attracts some haven flows in the wake of the prevalent risk-off environment and is further underpinned by stronger domestic inflation data released earlier this Friday. In fact, Japan’s Nationwide Core Consumer Price Index (CPI), which excludes fresh food but includes energy items, eased from 3.4% to 3.2% in May, though surpass market estimates. Furthermore, the gauge excluding fuel costs rose at the fastest annual pace in 42 years, highlighting that the underlying inflation remained heated and put pressure on the Bank of Japan (BoJ).
The Japanese central bank, however, recently reiterated that it has no plans to alter its ultra-loose policy. This marks a bid divergence in comparison to a more hawkish stance adopted by other major central banks, which might continue to undermine the JPY and help limit losses for the EUR/JPY cross. This, in turn, suggests that the ongoing corrective pullback is solely led by some long-unwinding heading into the weekend. Nevertheless, spot prices now seem to have erased a major part of the weekly gains. That said, any subsequent fall is more likely to attract fresh buyers and remain limited.
Technical Levels: Supports and Resistances
EURJPY currently trading at 155.31 at the time of writing. Pair opened at 156.79 and is trading with a change of -0.94 % .
| Overview | Overview.1 | |
|---|---|---|
| 0 | Today last price | 155.31 |
| 1 | Today Daily Change | -1.48 |
| 2 | Today Daily Change % | -0.94 |
| 3 | Today daily open | 156.79 |
The pair remains strongly bullish on the daily timeframe. It trades above its 20 SMA @ 151.6, 50 SMA 149.68, 100 SMA @ 146.47 and 200 SMA @ 144.73.
| Trends | Trends.1 | |
|---|---|---|
| 0 | Daily SMA20 | 151.60 |
| 1 | Daily SMA50 | 149.68 |
| 2 | Daily SMA100 | 146.47 |
| 3 | Daily SMA200 | 144.73 |
The previous day high was 156.93 while the previous day low was 155.61. The daily 38.2% Fib levels comes at 156.43, expected to provide resistance. Similarly, the daily 61.8% fib level is at 156.12, expected to provide resistance.
Note the levels of interest below:
- Pivot support is noted at 155.96, 155.13, 154.64
- Pivot resistance is noted at 157.27, 157.76, 158.59
| Levels | Levels.1 |
|---|---|
| Previous Daily High | 156.93 |
| Previous Daily Low | 155.61 |
| Previous Weekly High | 155.27 |
| Previous Weekly Low | 149.67 |
| Previous Monthly High | 151.62 |
| Previous Monthly Low | 146.14 |
| Daily Fibonacci 38.2% | 156.43 |
| Daily Fibonacci 61.8% | 156.12 |
| Daily Pivot Point S1 | 155.96 |
| Daily Pivot Point S2 | 155.13 |
| Daily Pivot Point S3 | 154.64 |
| Daily Pivot Point R1 | 157.27 |
| Daily Pivot Point R2 | 157.76 |
| Daily Pivot Point R3 | 158.59 |
[/s2If]
Nehcap Expert Advisor
The NEHCAP MT4 EA is high quality professional trading system geared to generate returns without using GRID or martingales. Each trade has strict risk per trade parameter. The pairs under management include EURUSD, GBPUSD, AUDCAD, AUDNZD,GBPAUD, EURAUD, EURCAD, CHFJPY and many more.
The system is trading live: LIVE ACCOUNT TRACKING
You can run it free. Apply for a free trial and track our account. Buy the system or use profit share mechanism to generate returns on your MT4.
Join Our Telegram Group
")


