As a result of a discouraging global outlook, there has been a significant demand for the USD Index, causing the USDCAD to surge from 1.31933 to 1.3200.
…
This is a premium post.
[s2If !current_user_can(access_s2member_level4)]Please register for FREE REGISTER to read full post below containing analysis. In case of any error or you think you are not able to read the full post below, please email us at support#nehcap.com [lwa][/s2If] [s2If current_user_can(access_s2member_level1)]
- USD/CAD has jumped to 1.3200 amid solid appeal for the USD Index due to a bleak global outlook.
The pair currently trades last at 1.31933.
The previous day high was 1.318 while the previous day low was 1.3139. The daily 38.2% Fib levels comes at 1.3154, expected to provide support. Similarly, the daily 61.8% fib level is at 1.3164, expected to provide support.
The USD/CAD pair has jumped sharply to near the round-level resistance of 1.3200 in the London session. The Loonie asset has picked significant bids as the US Dollar Index (DXY) is showing severe resilience and the oil prices are dropped sharply.
Oil prices are facing the heat as hawkish central banks have threatened global economic prospects. It is worth noting that Canada is the leading exporter of oil to the United States and weak oil prices impact the Canadian Dollar.
The US Dollar Index (DXY) has climbed to near 103.00 amid tailwinds of the risk-aversion theme. Also, hawkish Federal Reserve (Fed) bets have strengthened the appeal for the US Dollar.
USD/CAD is auctioning in a Falling Channel chart pattern on an hourly scale in which each pullback is considered a selling opportunity by the market participants. The 100-period Exponential Moving Average (EMA) at 1.3196 is acting as a stiff barricade for the US Dollar bulls.
Contrary to that, the Relative Strength Index (RSI) (14) has stepped into the bullish range of 60.00-80.00, however, the downside risks are still elevated.
Going forward, a downside move below June 16 low at 1.3177 could expose the asset to June 22 low at 1.3139 followed by the round-level support at 1.3100.
On the flip side, a decisive move above June 15 high at 1.3355 would drive the asset to June 12 high at 1.3384 and June 06 high at 1.3452.
Technical Levels: Supports and Resistances
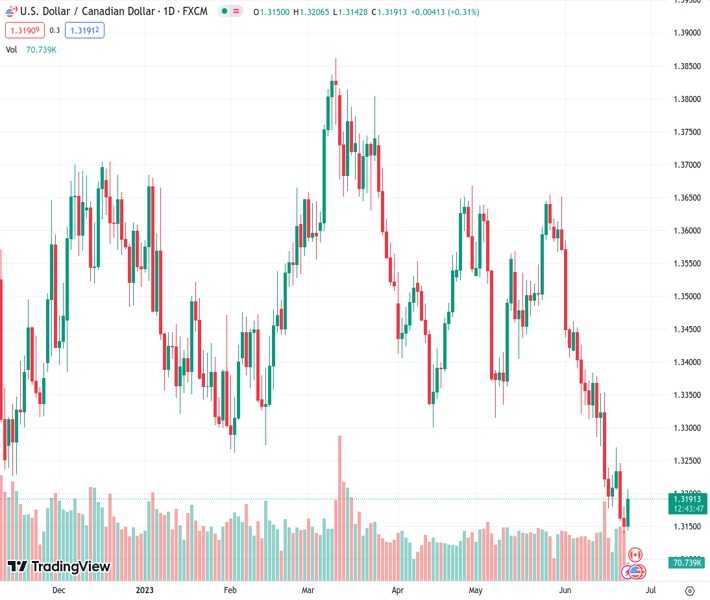
USDCAD currently trading at 1.3196 at the time of writing. Pair opened at 1.3152 and is trading with a change of 0.33 % .
| Overview | Overview.1 | |
|---|---|---|
| 0 | Today last price | 1.3196 |
| 1 | Today Daily Change | 0.0044 |
| 2 | Today Daily Change % | 0.3300 |
| 3 | Today daily open | 1.3152 |
The pair remains strongly bearish on the daily time frame. It trades below the 20 SMA @ 1.3368, 50 SMA 1.345, 100 SMA @ 1.3507 and 200 SMA @ 1.352.
| Trends | Trends.1 | |
|---|---|---|
| 0 | Daily SMA20 | 1.3368 |
| 1 | Daily SMA50 | 1.3450 |
| 2 | Daily SMA100 | 1.3507 |
| 3 | Daily SMA200 | 1.3520 |
The previous day high was 1.318 while the previous day low was 1.3139. The daily 38.2% Fib levels comes at 1.3154, expected to provide support. Similarly, the daily 61.8% fib level is at 1.3164, expected to provide support.
Note the levels of interest below:
- Pivot support is noted at 1.3134, 1.3116, 1.3093
- Pivot resistance is noted at 1.3174, 1.3197, 1.3215
| Levels | Levels.1 |
|---|---|
| Previous Daily High | 1.3180 |
| Previous Daily Low | 1.3139 |
| Previous Weekly High | 1.3384 |
| Previous Weekly Low | 1.3178 |
| Previous Monthly High | 1.3655 |
| Previous Monthly Low | 1.3315 |
| Daily Fibonacci 38.2% | 1.3154 |
| Daily Fibonacci 61.8% | 1.3164 |
| Daily Pivot Point S1 | 1.3134 |
| Daily Pivot Point S2 | 1.3116 |
| Daily Pivot Point S3 | 1.3093 |
| Daily Pivot Point R1 | 1.3174 |
| Daily Pivot Point R2 | 1.3197 |
| Daily Pivot Point R3 | 1.3215 |
[/s2If]
Nehcap Expert Advisor
The NEHCAP MT4 EA is high quality professional trading system geared to generate returns without using GRID or martingales. Each trade has strict risk per trade parameter. The pairs under management include EURUSD, GBPUSD, AUDCAD, AUDNZD,GBPAUD, EURAUD, EURCAD, CHFJPY and many more.
The system is trading live: LIVE ACCOUNT TRACKING
You can run it free. Apply for a free trial and track our account. Buy the system or use profit share mechanism to generate returns on your MT4.
Join Our Telegram Group
")


