According to Nehcap, the NZDUSD currency pair experienced its largest daily decline in a two-week period, currently trading at 0.61368. However, they anticipate that the potential for further negative movement will be restricted.
…
This is a premium post.
[s2If !current_user_can(access_s2member_level4)]Please register for FREE REGISTER to read full post below containing analysis. In case of any error or you think you are not able to read the full post below, please email us at support#nehcap.com [lwa][/s2If] [s2If current_user_can(access_s2member_level1)]
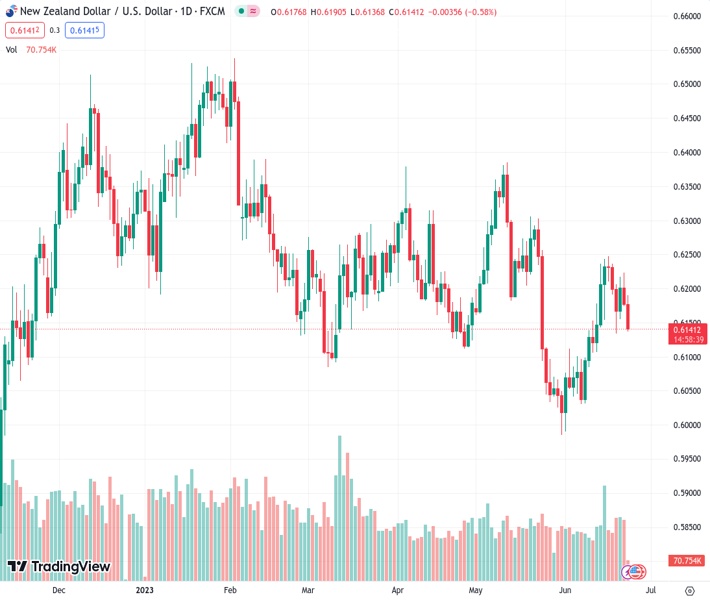
- NZD/USD prints the biggest daily loss in two weeks, so far.
The pair currently trades last at 0.61368.
The previous day high was 0.6224 while the previous day low was 0.6173. The daily 38.2% Fib levels comes at 0.6192, expected to provide resistance. Similarly, the daily 61.8% fib level is at 0.6205, expected to provide resistance.
NZD/USD takes offers to refresh intraday low around 0.6140 as it extends the previous day’s losses amid sour sentiment heading into Friday’s European session. In doing so, the Kiwi pair justifies the broad US Dollar strength ahead of the first readings of the US S&P Global PMIs for June.
Also read: NZD/USD drops to fresh daily low, around 0.6160 area amid renewed USD buying
Technically, the 14-day RSI returns to the normal territory surrounding the 50.00 round figure and suggests limited downside room, which in turn highlights a convergence of the 21-DMA and an upward-sloping trend line from May 31, close to 0.6120 at the latest.
That said, a 3.5-month-old horizontal support zone, around 0.6080, acts as an additional downside filter before directing the NZD/USD bears toward the yearly low of near 0.5985.
On the flip side, 38.2% and 50% Fibonacci retracement levels of the Kiwi pair’s February-May downturn, respectively near 0.6200 and 0.6265, restrict short-term advances of the quote.
Following that, a descending resistance line from early February and the 61.8% Fibonacci retracement, close to 0.6315 and 0.6330 in that order, will act as the final defense of the pair sellers.
Trend: Limited downside expected
Technical Levels: Supports and Resistances
NZDUSD currently trading at 0.6141 at the time of writing. Pair opened at 0.6178 and is trading with a change of -0.60% % .
| Overview | Overview.1 | |
|---|---|---|
| 0 | Today last price | 0.6141 |
| 1 | Today Daily Change | -0.0037 |
| 2 | Today Daily Change % | -0.60% |
| 3 | Today daily open | 0.6178 |
The pair is trading above its 20 Daily moving average @ 0.612, below its 50 Daily moving average @ 0.6175 , below its 100 Daily moving average @ 0.6207 and below its 200 Daily moving average @ 0.6155
| Trends | Trends.1 | |
|---|---|---|
| 0 | Daily SMA20 | 0.6120 |
| 1 | Daily SMA50 | 0.6175 |
| 2 | Daily SMA100 | 0.6207 |
| 3 | Daily SMA200 | 0.6155 |
The previous day high was 0.6224 while the previous day low was 0.6173. The daily 38.2% Fib levels comes at 0.6192, expected to provide resistance. Similarly, the daily 61.8% fib level is at 0.6205, expected to provide resistance.
Note the levels of interest below:
- Pivot support is noted at 0.6159, 0.6141, 0.6108
- Pivot resistance is noted at 0.621, 0.6243, 0.6261
| Levels | Levels.1 |
|---|---|
| Previous Daily High | 0.6224 |
| Previous Daily Low | 0.6173 |
| Previous Weekly High | 0.6250 |
| Previous Weekly Low | 0.6076 |
| Previous Monthly High | 0.6385 |
| Previous Monthly Low | 0.5985 |
| Daily Fibonacci 38.2% | 0.6192 |
| Daily Fibonacci 61.8% | 0.6205 |
| Daily Pivot Point S1 | 0.6159 |
| Daily Pivot Point S2 | 0.6141 |
| Daily Pivot Point S3 | 0.6108 |
| Daily Pivot Point R1 | 0.6210 |
| Daily Pivot Point R2 | 0.6243 |
| Daily Pivot Point R3 | 0.6261 |
[/s2If]
Nehcap Expert Advisor
The NEHCAP MT4 EA is high quality professional trading system geared to generate returns without using GRID or martingales. Each trade has strict risk per trade parameter. The pairs under management include EURUSD, GBPUSD, AUDCAD, AUDNZD,GBPAUD, EURAUD, EURCAD, CHFJPY and many more.
The system is trading live: LIVE ACCOUNT TRACKING
You can run it free. Apply for a free trial and track our account. Buy the system or use profit share mechanism to generate returns on your MT4.
Join Our Telegram Group
")


