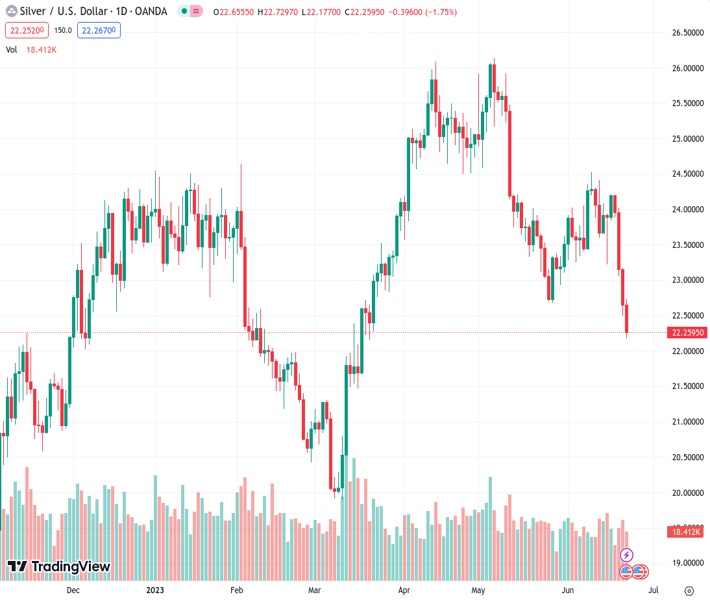
The value of silver, indicated by #XAGUSD at 22.246, has dropped by 1.8% after breaking an important level of support. Predictions indicate that the price will continue to decline until it reaches $21.00.
…
This is a premium post.
[s2If !current_user_can(access_s2member_level4)]Please register for FREE REGISTER to read full post below containing analysis. In case of any error or you think you are not able to read the full post below, please email us at support#nehcap.com [lwa][/s2If] [s2If current_user_can(access_s2member_level1)]
- Silver prices nosedive 1.8% as they breach crucial support, with sights set on $21.00.
The pair currently trades last at 22.246.
The previous day high was 23.18 while the previous day low was 22.5. The daily 38.2% Fib levels comes at 22.76, expected to provide resistance. Similarly, the daily 61.8% fib level is at 22.92, expected to provide resistance.
Silver price plunges past the May 26 daily low support at $22.68, extending its losses towards the $22.20 area with sellers eyeing the $21.00 handle. Therefore, XAG/USD Is trading at $22.23, down by 1.80% after hitting a daily high of $22.72, slightly below the 200-day Exponential Moving Average (EMA)
Given the backdrop, XAG/USD’s turned bearish after falling below the 200-day EMA and below the prior’s market structure swing low of May 26. The Relative Strength Index (RSI) indicator is also still in bearish territory. At the same time, the three-day Rate of Change (RoC) has printed its lowest level since the beginning of February 3, after the 4.69% plunge that began the snowball fall of Silver prices toward the lowest price of the year, at $19.92.
The XAG/USD first support would be the $22.00 figure. A breach of the latter will expose the March 16 swing low of $21.47, followed by the March 10 daily high at $20.78. Once cleared, the next test would be the year-to-date (YTD) low of $19.92.
Conversely, if XAG/USD buyers stepped in and claimed the 200-day EMA, that could pave the way for sideways price action.
Technical Levels: Supports and Resistances
XAGUSD currently trading at 22.25 at the time of writing. Pair opened at 22.66 and is trading with a change of -1.81 % .
| Overview | Overview.1 | |
|---|---|---|
| 0 | Today last price | 22.25 |
| 1 | Today Daily Change | -0.41 |
| 2 | Today Daily Change % | -1.81 |
| 3 | Today daily open | 22.66 |
The pair remains strongly bearish on the daily time frame. It trades below the 20 SMA @ 23.61, 50 SMA 24.32, 100 SMA @ 23.35 and 200 SMA @ 22.46.
| Trends | Trends.1 | |
|---|---|---|
| 0 | Daily SMA20 | 23.61 |
| 1 | Daily SMA50 | 24.32 |
| 2 | Daily SMA100 | 23.35 |
| 3 | Daily SMA200 | 22.46 |
The previous day high was 23.18 while the previous day low was 22.5. The daily 38.2% Fib levels comes at 22.76, expected to provide resistance. Similarly, the daily 61.8% fib level is at 22.92, expected to provide resistance.
Note the levels of interest below:
- Pivot support is noted at 22.38, 22.1, 21.7
- Pivot resistance is noted at 23.06, 23.46, 23.75
| Levels | Levels.1 |
|---|---|
| Previous Daily High | 23.18 |
| Previous Daily Low | 22.50 |
| Previous Weekly High | 24.40 |
| Previous Weekly Low | 23.22 |
| Previous Monthly High | 26.14 |
| Previous Monthly Low | 22.68 |
| Daily Fibonacci 38.2% | 22.76 |
| Daily Fibonacci 61.8% | 22.92 |
| Daily Pivot Point S1 | 22.38 |
| Daily Pivot Point S2 | 22.10 |
| Daily Pivot Point S3 | 21.70 |
| Daily Pivot Point R1 | 23.06 |
| Daily Pivot Point R2 | 23.46 |
| Daily Pivot Point R3 | 23.75 |
[/s2If]
Nehcap Expert Advisor
The NEHCAP MT4 EA is high quality professional trading system geared to generate returns without using GRID or martingales. Each trade has strict risk per trade parameter. The pairs under management include EURUSD, GBPUSD, AUDCAD, AUDNZD,GBPAUD, EURAUD, EURCAD, CHFJPY and many more.
The system is trading live: LIVE ACCOUNT TRACKING
You can run it free. Apply for a free trial and track our account. Buy the system or use profit share mechanism to generate returns on your MT4.
Join Our Telegram Group
")


