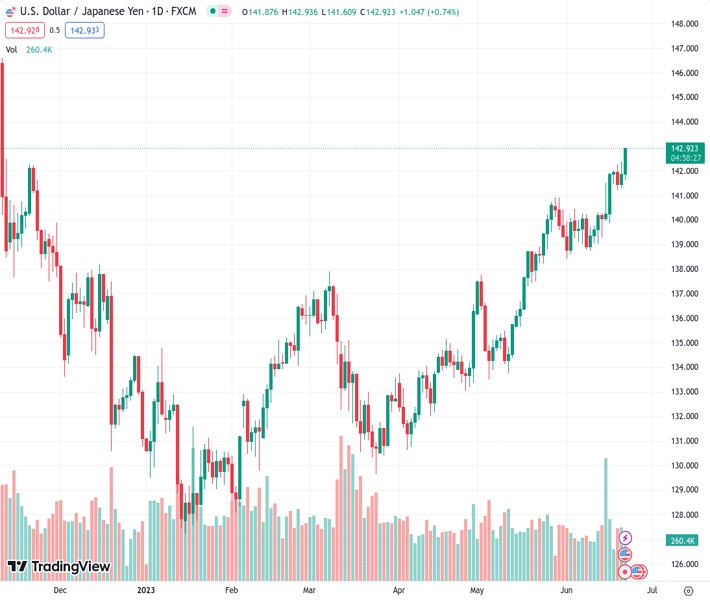
The USDJPY pair reached its highest point of the year at 142.88 due to a rise in the value of the US Dollar, which was bolstered by Federal Reserve Chair Jerome Powell’s hawkish remarks.
…
This is a premium post.
[s2If !current_user_can(access_s2member_level4)]Please register for FREE REGISTER to read full post below containing analysis. In case of any error or you think you are not able to read the full post below, please email us at support#nehcap.com [lwa][/s2If] [s2If current_user_can(access_s2member_level1)]
- USD/JPY ascends to a YTD peak of 142.88 as Fed Chair Jerome Powell’s hawkish commentary strengthens the US Dollar.
The pair currently trades last at 142.871.
The previous day high was 142.37 while the previous day low was 141.28. The daily 38.2% Fib levels comes at 141.95, expected to provide support. Similarly, the daily 61.8% fib level is at 141.7, expected to provide support.
USD/JPY climbs to new year-to-date (YTD) highs at around 142.88 on Thursday, as the Federal Reserve (Fed) Chair Jerome Powell gets ready to finish its two-day testimony before the US Congress. Hawkish comments by Powell rattled Wall Street and underpinned the US Dollar (USD), recovering lost ground. The USD/JPY exchanged hands at 142.82 after hitting a low of 141.61.
Global equities trade with losses. Aside from Powell’s comments on Wednesday, three major central banks raised rates, with the Bank of England (BoE) surprising the markets with a 50 bps hike, though it failed to boost the Pound Sterling (GBP). However, sentiment dampened as more central banks tightened monetary conditions, reigniting fears of a global economic slowdown.
Back to the US, data from the US Bureau of Labor Statistics (BLS) showed Initial Jobless Claims printing at its highest level since October 2021, jumping by 264K exceeding estimates of 260K. At the same time, the US Commerce Department released the US Current Account widened to $219.3 billion in Q1, from a revised $216.2 billion in Q4 2022, exceeding estimates of $217.5 billion.
Recently crossing the wires, Existing Home Sales in May grew at a 0.2% MoM pace, above estimates of a -0.5% plunge, more than the upward revised April-s -3.2% contraction.
Even though data was mixed, the USD/JPY gained traction as bond yields rose. The US 10-year Treasury note yields 3.783%, five basis points higher than its open, underpinning the USD. The US Dollar Index (DXY) measures the buck’s value vs. its peers, advances to 102.377, and gains 0.30%.
On the Japanese front, the USD/JPY gets some help from dovish comments made by the Bank of Japan (BoJ) board member Asahi Noguchi favoring the ultra-loose monetary policy to ensure wages, seen as a pivotal factor to drive inflation to its 2% target over a sustained period. Noguchi added that while core inflation is above the BoJ 2% target, it is seen as getting below the latter as the effect of high raw material prices “dissipates.”
The Japanese economic agenda will feature inflation data, with most May readings expected to surpass the prior’s month data. In the US, S&P Global PMIs, and Fed speakers, are expected to deliver proper direction to the USD/JPY pair.
The USD/JPY is still upward biased, threatening to crack the 143.00 mark. If buyers conquer the latter, there would be no resistance between the current exchange rate and last year’s November 10 high of 146.59. The only possible resistance would be the October 27 daily low-turned resistance at 145.10. USD/JPY failure to crack 143.00, could open the door for further downside, like the November 22 high turned support at 142.24, followed by the 142.00 figure.
Technical Levels: Supports and Resistances
USDJPY currently trading at 142.86 at the time of writing. Pair opened at 141.88 and is trading with a change of 0.69 % .
| Overview | Overview.1 | |
|---|---|---|
| 0 | Today last price | 142.86 |
| 1 | Today Daily Change | 0.98 |
| 2 | Today Daily Change % | 0.69 |
| 3 | Today daily open | 141.88 |
The pair remains strongly bullish on the daily timeframe. It trades above its 20 SMA @ 140.21, 50 SMA 137.4, 100 SMA @ 135.37 and 200 SMA @ 137.21.
| Trends | Trends.1 | |
|---|---|---|
| 0 | Daily SMA20 | 140.21 |
| 1 | Daily SMA50 | 137.40 |
| 2 | Daily SMA100 | 135.37 |
| 3 | Daily SMA200 | 137.21 |
The previous day high was 142.37 while the previous day low was 141.28. The daily 38.2% Fib levels comes at 141.95, expected to provide support. Similarly, the daily 61.8% fib level is at 141.7, expected to provide support.
Note the levels of interest below:
- Pivot support is noted at 141.32, 140.76, 140.24
- Pivot resistance is noted at 142.41, 142.93, 143.49
| Levels | Levels.1 |
|---|---|
| Previous Daily High | 142.37 |
| Previous Daily Low | 141.28 |
| Previous Weekly High | 141.92 |
| Previous Weekly Low | 139.01 |
| Previous Monthly High | 140.93 |
| Previous Monthly Low | 133.50 |
| Daily Fibonacci 38.2% | 141.95 |
| Daily Fibonacci 61.8% | 141.70 |
| Daily Pivot Point S1 | 141.32 |
| Daily Pivot Point S2 | 140.76 |
| Daily Pivot Point S3 | 140.24 |
| Daily Pivot Point R1 | 142.41 |
| Daily Pivot Point R2 | 142.93 |
| Daily Pivot Point R3 | 143.49 |
[/s2If]
Nehcap Expert Advisor
The NEHCAP MT4 EA is high quality professional trading system geared to generate returns without using GRID or martingales. Each trade has strict risk per trade parameter. The pairs under management include EURUSD, GBPUSD, AUDCAD, AUDNZD,GBPAUD, EURAUD, EURCAD, CHFJPY and many more.
The system is trading live: LIVE ACCOUNT TRACKING
You can run it free. Apply for a free trial and track our account. Buy the system or use profit share mechanism to generate returns on your MT4.
Join Our Telegram Group
")


