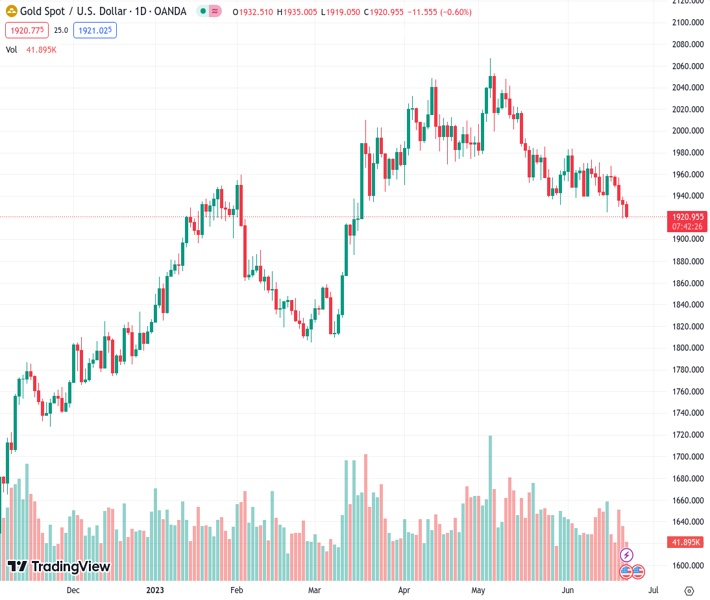
The price of gold at 1,920.20 has demonstrated a decline resembling a V-shape around $1,930.00 as the USD Index experiences a resurgence.
…
This is a premium post.
[s2If !current_user_can(access_s2member_level4)]Please register for FREE REGISTER to read full post below containing analysis. In case of any error or you think you are not able to read the full post below, please email us at support#nehcap.com [lwa][/s2If] [s2If current_user_can(access_s2member_level1)]
- Gold price has shown a V-shape sell-off around $1,930.00 amid a recovery in the USD Index.
The pair currently trades last at 1920.20.
The previous day high was 1939.54 while the previous day low was 1919.23. The daily 38.2% Fib levels comes at 1926.99, expected to provide resistance. Similarly, the daily 61.8% fib level is at 1931.78, expected to provide resistance.
Gold price (XAU/USD) has retreated after a solid recovery to near $1,930.00 in the early New York session. The precious metal has faced selling pressure despite the weekly jobless claims for the week ending June 16 have landed marginally higher than expectations. The US Department of Labor has reported that first-time jobless claims were 264K, similar to their prior release while the street was anticipating a figure of 260K.
S&P500 futures have recovered some losses, however, a weak opening is broadly expected. Investors have underpinned the risk-aversion theme as more rate hikes by the Federal Reserve (Fed) could accelerate fears of a recession in the United States.
Jobless claims have remained higher than expectations straight for the fourth time in a row. Higher jobless claims indicate that labor market conditions are critically losing their appeal. Easing US labor market conditions could propel the chances of only one interest rate hike by year-end.
The US Dollar Index (DXY) has rebounded to near day’s high around 102.16 as investors are providing more value to hawkish testimony by Fed chair Jerome Powell against dovish commentary by Atlanta Fed President Raphael Bostic and Chicago Fed Bank President Austan Goolsbee. The 10-year US Treasury yields have climbed above 3.75%.
Gold price is looking to deliver a break below the Descending Triangle chart pattern formed on a two-hour scale. The downward-sloping trendline of the aforementioned chart pattern is plotted from June 02 high at $1,983.00 while the horizontal support is placed from May 30 low at $1,932.12. The 200-period Exponential Moving Average (EMA) at $1,953.62 is acting as a barricade for the Gold bulls. Horizontal resistance is plotted from May 05 low around $2,000.00.
The Relative Strength Index (RSI) (14) is oscillating in the bearish range of 20.00-40.00, which indicates that the downside momentum has been triggered.
Technical Levels: Supports and Resistances
XAUUSD currently trading at 1926.03 at the time of writing. Pair opened at 1932.39 and is trading with a change of -0.33 % .
| Overview | Overview.1 | |
|---|---|---|
| 0 | Today last price | 1926.03 |
| 1 | Today Daily Change | -6.36 |
| 2 | Today Daily Change % | -0.33 |
| 3 | Today daily open | 1932.39 |
The pair is trading below its 20 Daily moving average @ 1952.53, below its 50 Daily moving average @ 1981.5 , below its 100 Daily moving average @ 1942.49 and above its 200 Daily moving average @ 1851.01
| Trends | Trends.1 | |
|---|---|---|
| 0 | Daily SMA20 | 1952.53 |
| 1 | Daily SMA50 | 1981.50 |
| 2 | Daily SMA100 | 1942.49 |
| 3 | Daily SMA200 | 1851.01 |
The previous day high was 1939.54 while the previous day low was 1919.23. The daily 38.2% Fib levels comes at 1926.99, expected to provide resistance. Similarly, the daily 61.8% fib level is at 1931.78, expected to provide resistance.
Note the levels of interest below:
- Pivot support is noted at 1921.23, 1910.08, 1900.92
- Pivot resistance is noted at 1941.54, 1950.7, 1961.85
| Levels | Levels.1 |
|---|---|
| Previous Daily High | 1939.54 |
| Previous Daily Low | 1919.23 |
| Previous Weekly High | 1971.01 |
| Previous Weekly Low | 1924.85 |
| Previous Monthly High | 2079.76 |
| Previous Monthly Low | 1932.12 |
| Daily Fibonacci 38.2% | 1926.99 |
| Daily Fibonacci 61.8% | 1931.78 |
| Daily Pivot Point S1 | 1921.23 |
| Daily Pivot Point S2 | 1910.08 |
| Daily Pivot Point S3 | 1900.92 |
| Daily Pivot Point R1 | 1941.54 |
| Daily Pivot Point R2 | 1950.70 |
| Daily Pivot Point R3 | 1961.85 |
[/s2If]
Nehcap Expert Advisor
The NEHCAP MT4 EA is high quality professional trading system geared to generate returns without using GRID or martingales. Each trade has strict risk per trade parameter. The pairs under management include EURUSD, GBPUSD, AUDCAD, AUDNZD,GBPAUD, EURAUD, EURCAD, CHFJPY and many more.
The system is trading live: LIVE ACCOUNT TRACKING
You can run it free. Apply for a free trial and track our account. Buy the system or use profit share mechanism to generate returns on your MT4.
Join Our Telegram Group
")


