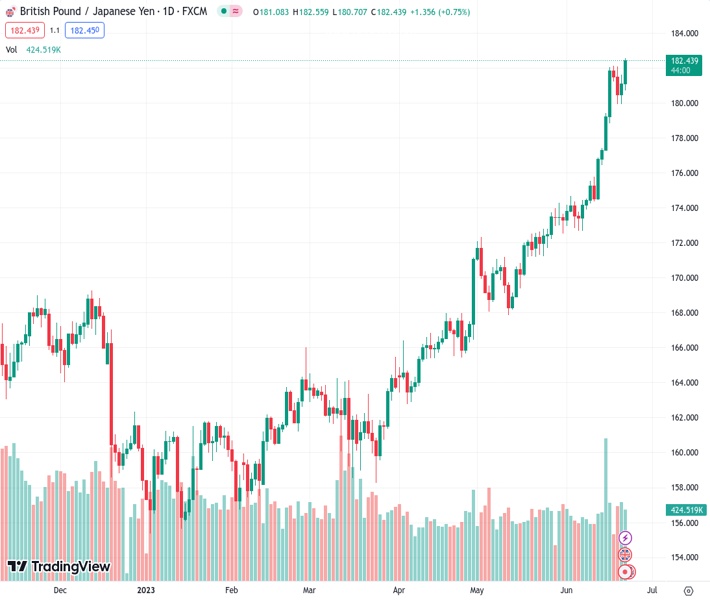
The GBPJPY was at 182.451 and fluctuated between 180.71 and 182.51 on Thursday.
…
This is a premium post.
[s2If !current_user_can(access_s2member_level4)]Please register for FREE REGISTER to read full post below containing analysis. In case of any error or you think you are not able to read the full post below, please email us at support#nehcap.com [lwa][/s2If] [s2If current_user_can(access_s2member_level1)]
- On Thursday the GBP/JPY traded in the 180.71 – 182.51 range.
The pair currently trades last at 182.451.
The previous day high was 181.61 while the previous day low was 179.92. The daily 38.2% Fib levels comes at 180.97, expected to provide support. Similarly, the daily 61.8% fib level is at 180.57, expected to provide support.
In Thursday’s session, the GBP gained ground against the JPY on the back of a hawkish Bank of England decision to raise rates by 50 basis points (bps) vs the 25 bps expected. As a result, rising British yields are tractioning the Sterling. However, investors are seeing a spooky outlook in the UK as the Fortune 500 (FTSE) saw sharp losses. In addition, hawkish remarks by Powell in its testimony before the US Senate, which hinted at more rate hikes this year, further weakened the Yen. All eyes are now on inflation data from Japan.
The Bank of England (BoE) raised interest rates from 4.5% to 5% with seven members of the Monetary Policy Committee (MPC) agreeing to a rate hike while two of them voted to hold the rates steady. In the statement, the Bank acknowledged that significant upside news in recent data points is set to contribute to inflationary pressures and that they will do “what is necessary to return inflation to 2% in the medium term”.
As a reaction, the British Bond market is experiencing increases in yields across different maturities. The 10-year Bond yield has climbed to 4.43%, while the 2-year yield is at 5.14%, and the 5-year yield is at 4.63%. Moreover, BoE’s hawkish stance significantly weakened the British Financial Times Stock Exchange 100 Index (FTSE) which fell to its lowest level since the beginning of June, following the decision, indicating a negative market sentiment in the UK, as more rate hikes tend to be associated with less economic activity.
On the other hand, market participants will keep an eye on Japanese inflation data from May in the early Friday Asian session. The headline Consumer Price Index is expected to accelerate to 4.1% YoY in May and the core measure to 4.4% YoY. In that sense, a hot inflation reading may force the Bank of Japan (BoJ) to reconsider its ultra-dovish stance and consider rate hikes.
Technically speaking, the GBP/JPY maintains a bullish outlook for the short term, as per indicators on the daily chart. However, the Relative Strength Index (RSI) and Moving Average Convergence Divergence (MACD) are both showing signs of exhaustion, indicating that the upside potential for the GBP is limited without a healthy downward correction.
In case the cross continues to gain traction, the following resistance line up at the daily high at 182.55, followed by the next round levels at 183.00 and 183.50. On the other hand, supports are seen at 182.00,181.00 and 180.00.
Technical Levels: Supports and Resistances
GBPJPY currently trading at 182.47 at the time of writing. Pair opened at 181.19 and is trading with a change of 0.71 % .
| Overview | Overview.1 | |
|---|---|---|
| 0 | Today last price | 182.47 |
| 1 | Today Daily Change | 1.28 |
| 2 | Today Daily Change % | 0.71 |
| 3 | Today daily open | 181.19 |
The pair remains strongly bullish on the daily timeframe. It trades above its 20 SMA @ 175.97, 50 SMA 171.93, 100 SMA @ 167.03 and 200 SMA @ 165.35.
| Trends | Trends.1 | |
|---|---|---|
| 0 | Daily SMA20 | 175.97 |
| 1 | Daily SMA50 | 171.93 |
| 2 | Daily SMA100 | 167.03 |
| 3 | Daily SMA200 | 165.35 |
The previous day high was 181.61 while the previous day low was 179.92. The daily 38.2% Fib levels comes at 180.97, expected to provide support. Similarly, the daily 61.8% fib level is at 180.57, expected to provide support.
Note the levels of interest below:
- Pivot support is noted at 180.21, 179.22, 178.52
- Pivot resistance is noted at 181.89, 182.6, 183.58
| Levels | Levels.1 |
|---|---|
| Previous Daily High | 181.61 |
| Previous Daily Low | 179.92 |
| Previous Weekly High | 182.04 |
| Previous Weekly Low | 174.36 |
| Previous Monthly High | 174.28 |
| Previous Monthly Low | 167.84 |
| Daily Fibonacci 38.2% | 180.97 |
| Daily Fibonacci 61.8% | 180.57 |
| Daily Pivot Point S1 | 180.21 |
| Daily Pivot Point S2 | 179.22 |
| Daily Pivot Point S3 | 178.52 |
| Daily Pivot Point R1 | 181.89 |
| Daily Pivot Point R2 | 182.60 |
| Daily Pivot Point R3 | 183.58 |
[/s2If]
Nehcap Expert Advisor
The NEHCAP MT4 EA is high quality professional trading system geared to generate returns without using GRID or martingales. Each trade has strict risk per trade parameter. The pairs under management include EURUSD, GBPUSD, AUDCAD, AUDNZD,GBPAUD, EURAUD, EURCAD, CHFJPY and many more.
The system is trading live: LIVE ACCOUNT TRACKING
You can run it free. Apply for a free trial and track our account. Buy the system or use profit share mechanism to generate returns on your MT4.
Join Our Telegram Group
")


